Dubai residential market January 2026
- Market Overview
- Key Market Metrics
- Price Trends & Market Interpretation
- Primary vs Secondary Market Composition
- Configuration Distribution
- Unit Size Trends & Market Signals
- Top Projects & Developer Activity
- Affordability Snapshot
- Buyer Profile & Demand Lens
- Rental Trends & Yield Outlook
- Configuration Spotlight
- Risks & Watchpoints
- Supply Snapshot
- Final Observations & Buyer Takeaways
- Data Source & Method Note
January opened with a Dubai apartment market that was active, balanced, and structurally familiar. Based on 12,064 registered freehold apartment transactions, the month reflected steady absorption rather than directional exuberance. Pricing remained disciplined, buyer behaviour followed established patterns, and off-plan sales continued to anchor market activity.
Compact apartments dominated volumes, reinforcing their role as the market’s liquidity engine. Studios, 1BRs, and 2BRs accounted for the overwhelming majority of transactions, with buyer comfort concentrated between AED 750,000 and AED 2 million. Larger homes and higher-ticket purchases remained present but selective, behaving more like conviction-led decisions than volume drivers.
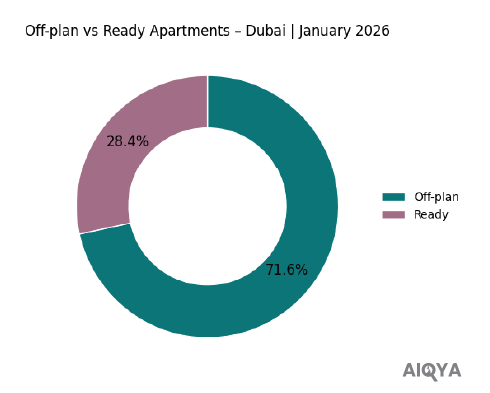
Off-plan transactions formed 71.6% of January activity, highlighting continued preference for structured payment plans and phased commitments over immediate handover. The secondary market remained active where product specificity justified it, particularly in established communities and well-positioned developments.
Rental indicators, read directionally, pointed to stable leasing conditions, supporting investor logic without signalling tenant stress. Hotel apartments, accounting for roughly 200 transactions, continued to function as a parallel, operator-led segment rather than part of the mainstream residential market.
Overall, January 2026 sets a credible baseline. Liquidity is intact, pricing discipline holds, and buyer behaviour remains rational. The month provides a clear reference frame against which February and March will reveal whether momentum builds, rotates, or holds steady.
Market Overview
| Dubai Residential (Freehold Apartments) | January 2026
January 2026 reflects a Dubai apartment market that is active without being hurried. Transaction volumes were broad-based, pricing remained anchored within familiar ranges, and buyer participation spanned both investment-led and end-user segments. Rather than signalling a shift in sentiment, the month establishes a measured starting point for the year.
Scope note: Residential, Freehold, Apartments only. Hotel Apartments included as a distinct sub-type.
Off-plan activity dominated the month, driven by launch-led supply and structured payment plans. At the same time, ready apartment transactions continued where location clarity and product specificity justified immediate commitment. Activity clustered across established liquidity corridors such as Jumeirah Village Circle, Dubai Land Residence Complex, Majan, and select urban districts, reinforcing the city’s familiar absorption geography.
Hotel apartments formed a small but visible layer of activity. These transactions are best read as structured-income placements rather than conventional home purchases and are treated separately in this report.
📝 Interpretation
January does not present a market in acceleration or retreat. It presents one organising itself around familiar anchors: compact units, phased commitments, and selective premium buying.
🧭 AIQYA Insight
Apartments tell us where liquidity sits. January confirms that liquidity remains intact and broadly distributed, providing a stable base for the quarter ahead.
Key Market Metrics
January’s numbers do not announce a turning point. Instead, they quietly establish the market’s operating range at the start of the year. Volumes were healthy, pricing held within familiar bands, and off-plan transactions continued to shape the overall composition of activity.
January 2026 – Market Scorecard
(Residential | Freehold | Apartments only | Flats + Hotel Apartments)
- Total transactions: 12,064
- Total transaction value: ~AED 25.9 billion
- Median price: ~AED 1,771 per sq ft
- Median ticket size: ~AED 1.38 million
- Off-plan share: 71.6%
- Ready (secondary) share: 28.4%
📝 Interpretation
The scale of activity confirms that liquidity remains intact. A median ticket near AED 1.4 million keeps the market squarely within investor and upgrader comfort zones, while pricing around AED 1,770 per sq ft reflects discipline rather than stretch. Importantly, these medians are shaped by mix: compact units and launch-led inventory exert more influence than secondary-market negotiation.
🧭 AIQYA Insight
January reads as a baseline month, not a momentum statement. When off-plan transactions account for more than two-thirds of activity, pricing signals are driven less by resale pressure and more by product design, payment structure, and launch positioning. This makes January an essential reference point. Any shift in February or March will be easier to identify against this stable starting frame.
Price Trends & Market Interpretation
January pricing needs to be read with restraint. Early-year transactions tend to reflect a reset in expectations rather than a decisive shift in sentiment. New launches, selective resale deals, and a preference for compact, tradeable units all feed into the month’s median, shaping how prices appear on paper without necessarily changing how buyers behave on the ground.
How prices behaved in January
- Citywide median pricing held near AED 1,800 per sq ft, a level that has now become a familiar anchor rather than a moving target.
- Off-plan pricing shaped the median, with launch-led inventory setting the tone more than secondary market negotiation.
- Price dispersion widened by location, with premium districts maintaining higher psf bands, while high-volume suburban markets pulled the overall median back toward affordability.
📝 Interpretation
January does not show a market stretching itself. Instead, it shows a market sorting itself.
Premium locations continued to command higher pricing, but without aggressive upward pressure. At the same time, value-led corridors absorbed volume efficiently, reinforcing the role of smaller, well-priced units in maintaining liquidity. The result is a median that looks stable, even as the underlying price bands remain wide.
This is an important distinction. Stability here does not mean uniformity. It means that buyers are choosing where to pay more, rather than paying more everywhere.
🧭 AIQYA Insight
January’s pricing is best understood as composition-led stability. When a month is dominated by off-plan launches and compact unit sizes, median psf becomes a reflection of mix rather than momentum. For analysts and buyers alike, this means January should be treated as a reference frame, not a directional signal. True price movement, if any, will only become visible as resale volumes reassert themselves later in the quarter.
Primary vs Secondary Market Composition
The split between off-plan and ready apartments in January offers one of the clearest readings of buyer preference at the start of the year. More than pricing alone, this balance reflects how buyers are choosing to manage flexibility, timing, and commitment in a market where choice remains abundant.
January 2026 – Market Split (Apartments Only)
- Off-plan apartments: 71.6%
- Ready (secondary) apartments: 28.4%
📝 Interpretation
Off-plan dominance in January is less a signal of speculative appetite and more a reflection of structure-led decision-making. Payment plans, phased commitments, and launch positioning continue to attract buyers who value flexibility over immediacy. This is particularly visible in the compact and mid-ticket segments, where capital staging matters as much as headline pricing.
The secondary market, while smaller in share, remained active where product specificity justified immediate commitment. Ready apartment transactions were driven by location clarity, established communities, and usable layouts, rather than volume-led trading.
🧭 AIQYA Insight
January reinforces a familiar two-speed pattern. Off-plan apartments act as the volume stabiliser, absorbing demand through structured offerings, while ready apartments act as the conviction layer, moving selectively when the product is distinct enough to warrant immediacy. This balance suggests confidence has not retreated from completed stock; it has simply become more discerning.
Configuration Distribution
– What Are Buyers Choosing?
January’s unit mix reads like a market leaning into liquidity first, with compact formats carrying the bulk of activity. Bigger homes did transact, but they behaved more like a conviction purchase than a volume segment.
Configuration split (Jan 2026 | Flats + Hotel Apartments)
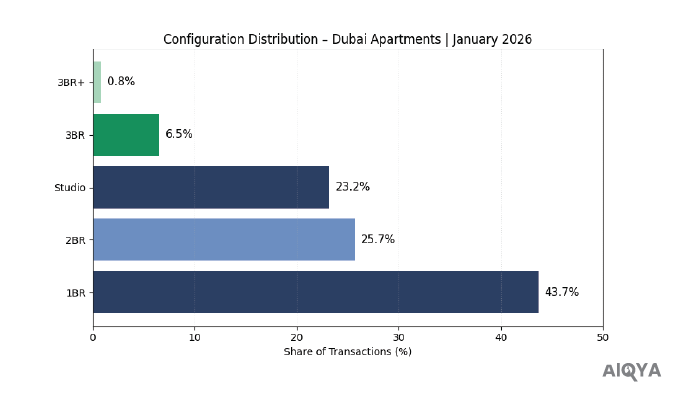
- 1BR: 5,278 (43.7%)
- 2BR: 3,103 (25.7%)
- Studio: 2,797 (23.2%)
- 3BR: 790 (6.5%)
- 3BR+: 95 (0.8%)
- Unknown/Other: 1 (negligible)
📝 Interpretation
The month was driven by the compact core (Studios + 1BR + 2BR = ~92.6% of transactions). This is the market’s liquidity engine in action: lower entry tickets, easier exit, and broader buyer pools.
🧭 AIQYA Insight
January’s mix suggests buyers were optimising for tradeability and flexibility rather than stretching for space. Larger formats remained present but thin, behaving more like a “lifestyle ballast” segment, moving when the unit is specific enough to justify the commitment.
Unit Size Trends & Market Signals
Unit sizes often reveal the market’s “quiet engineering”. Not just what buyers chose, but what developers are choosing to build, and what resale stock still offers. January’s size profile shows a familiar Dubai duality: compact new supply built for liquidity, and slightly roomier ready homes trading on liveability.
Median unit sizes by configuration (Jan 2026 | Flats + Hotel Apartments | Freehold)
- Studio: 38.3 sqm (~412 sq ft)
- 1BR: 73.2 sqm (~788 sq ft)
- 2BR: 116.0 sqm (~1,248 sq ft)
- 3BR: 173.0 sqm (~1,862 sq ft)
- 3BR+: 375.7 sqm (~4,044 sq ft) (thin volume segment)
📝 Interpretation
The size ladder is clean and consistent, and it supports what we saw in configuration mix: liquidity is being carried by formats that keep tickets manageable. Studios and 1BRs remain decisively compact, while 2BRs sit in a relatively stable mid-band that works for both investors and small families.
Off-plan vs Ready: where sizes differ (median actual area)
- Studios: Off-plan 37.4 sqm vs Ready 41.3 sqm
- 2BR: Off-plan 115.1 sqm vs Ready 119.5 sqm
- 3BR: Off-plan 172.3 sqm vs Ready 181.3 sqm
🧭 AIQYA Insight
January reinforces a structural pattern: new supply tends to optimise efficiency, while the ready market still holds pockets of “space premium”. The most visible gap is in studios, where off-plan units are notably tighter. This matters because compact units are the market’s liquidity engine, but it also means end-users shopping for comfort often find better spatial value in selective ready stock, even at a higher psf.
Top Projects & Developer Activity
If January is a composition month, the project leaderboard tells you who shaped that composition. The top-traded projects reveal where launch momentum concentrated, which brands pulled repeat demand, and how much of the month was driven by a broad market versus a handful of high-volume towers.
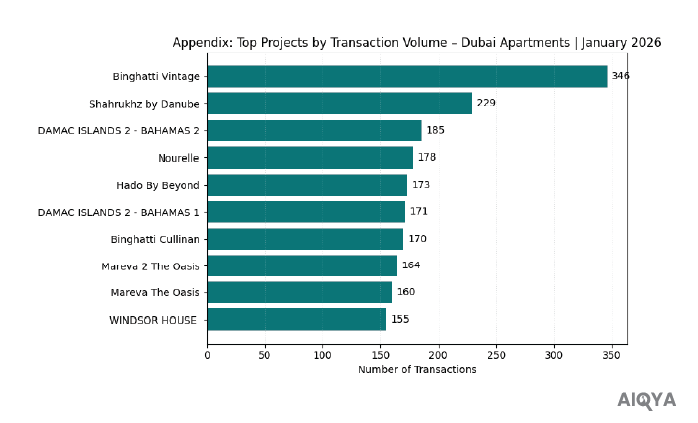
Top projects by transaction volume (Jan 2026 | Flats + Hotel Apartments | Freehold)
- Binghatti Vintage (346)
- Nourelle (178)
- Hado By Beyond (173)
- Binghatti Cullinan (169)
- Windsor House (155)
- Creek Bay (145)
- Creek Haven (140)
- Terra Gardens (138)
- DAMAC Riverside Views – Azure 2 (128)
- Palace Residences Hillside A (112)
(Next tier by volume: Lyvia by Palace, Hadley Heights 2, Avarra by Palace, Kanyon by Beyond, Samana Boulevard Heights.)
Concentration check
- Top 5 projects = ~8.5% of January transactions
- Top 10 projects = ~14.0% of January transactions
📝 Interpretation
January’s activity is not overly concentrated. Even the busiest projects do not dominate the month. That’s a healthy sign for market breadth: demand is distributed across many developments rather than being dependent on one or two headline launches.
At the same time, the leaderboard shows clear “launch pull”. Multiple projects from the same brand family appearing in the top tier suggests repeat buyer comfort with delivery track record, pricing structure, and unit sizing.
🧭 AIQYA Insight
Two patterns stand out:
- Repeatable brands drive liquidity. Projects that behave like a “series” (multiple towers, consistent unit logic, familiar payment plans) tend to attract investors looking for predictable entry and exit.
- Premium-branded residences appear, but selectively. Their presence signals confidence, but their volumes stay measured, which is typical: these assets trade on specificity (views, location, brand positioning) rather than mass absorption.
Affordability Snapshot
| Where Buyers Are Spending
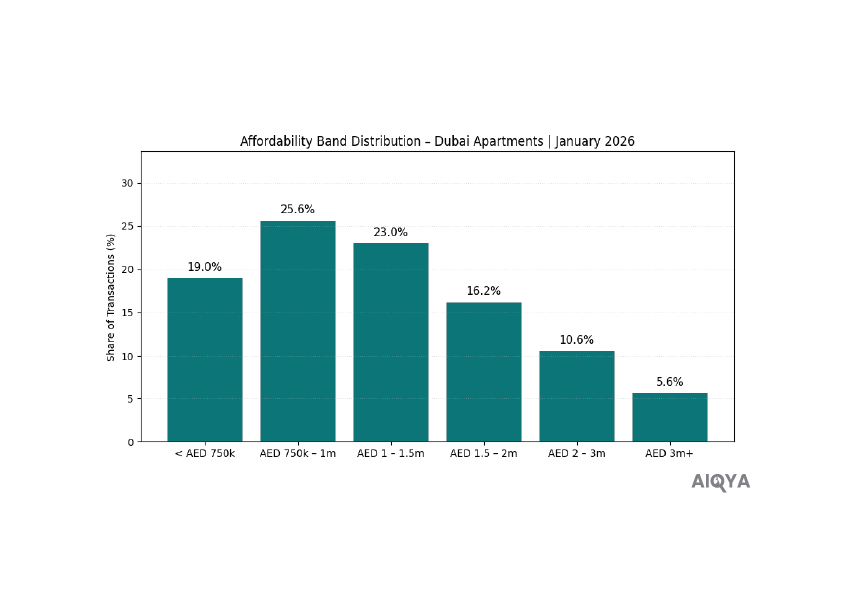
Affordability in Dubai is rarely about “cheap versus expensive”. It is about where the market’s comfort bands sit, and how much of the month was driven by compact entry tickets versus bigger, conviction-led purchases. January’s distribution shows a market that stayed broadly mid-ticket, with meaningful activity on both ends.
January 2026 – Ticket Size Bands (Flats + Hotel Apartments | Freehold)
- < AED 750k: 2,287 transactions (19.0%)
- AED 750k–1.25m: 3,083 (25.6%)
- AED 1.25–2m: 2,775 (23.0%)
- AED 2–3m: 1,957 (16.2%)
- AED 3–5m: 1,284 (10.6%)
- AED 5m+: 678 (5.6%)
Median ticket (January): ~AED 1.38m
📝 Interpretation
The market’s centre of gravity sat firmly in the AED 750k–2m band, which alone accounts for just under half of all transactions (~48.6%). This is the zone where Dubai’s liquidity is most dependable: compact apartments, investable entry points, and upgraders who want timing flexibility.
At the same time, the presence of ~16% of transactions above AED 3m shows the higher-ticket market did not disappear. It simply traded with more selectivity.
🧭 AIQYA Insight
January reads like a market where buyers prioritised optionalities. The sub-AED 1.25m segment behaves like the liquidity engine (entry price, exit price, broader buyer pool), while the AED 3m+ segment behaves like lifestyle ballast (moving when the product is specific enough: location, view, brand, or built quality).
This balance is healthy. It suggests the market is not being held up by only one buyer type.
Buyer Profile & Demand Lens
January demand in Dubai rarely fits a single buyer story. The month’s transaction mix suggests a market driven by three overlapping motivations: investors seeking liquidity, end-users buying stability, and upgraders buying timing. The affordability bands and configuration skew make it clear which segment carried the bulk of volume, and which segments moved selectively.
What the January mix suggests about buyer behaviour
1) Investors: still the volume driver
- The dominance of studios, 1BRs, and 2BRs points to buyer preference for units that are easier to rent and easier to exit.
- The heavy share of transactions within AED 750k–2m aligns with investor entry bands where yields and liquidity tend to remain practical.
📝 Interpretation
This is classic Dubai market behaviour: compact units act as the liquidity engine, and January leaned into that engine.
2) End-users: present, but more selective
- The thinner share of 3BR and 3BR+ transactions suggests end-user purchases did happen, but were not the dominant flow.
- Ready-home buying remained a meaningful share of the market, indicating that some buyers still prioritised immediacy and usability over future delivery.
🧭 AIQYA Insight
End-users tend to move when the product reduces friction: sensible layouts, established community infrastructure, clear access, and liveable size. In January, that demand looks more discerning than aggressive.
3) Upgraders: buying structure, not speed
- Off-plan dominance does not automatically mean speculation. It often means planned upgrading, where payment plans allow households to commit without forcing a sudden capital jump.
- This is especially true in the mid-ticket bands where buyers can trade up gradually.
📝 Interpretation
Upgrader demand tends to show up as “quiet confidence” rather than headline spikes. January’s numbers read closer to that pattern.
A distinct buyer pocket: Hotel Apartments
Hotel apartment transactions, while small in share, represent a specific profile: buyers prioritising managed-use formats and clearer operational outcomes. These purchases behave more like an income-structure decision than a home selection decision, which is why they sit outside standard affordability and end-user narratives.
🧭 AIQYA Insight | January takeaway
January demand shows a market optimising for flexibility and tradeability, not stretching for size. Investors carried volume, end-users remained present but selective, and off-plan structures continued to serve both investors and phased upgraders. It’s a market with movement, but not haste.
Rental Trends & Yield Outlook
Rental data in January works best as a stability check, not a headline story. Leasing cycles run on renewals, tenure decisions, and tenant budgets, so the signal is typically steadier than sales. Used carefully, it tells us whether the occupancy and affordability backbone of the market is holding.
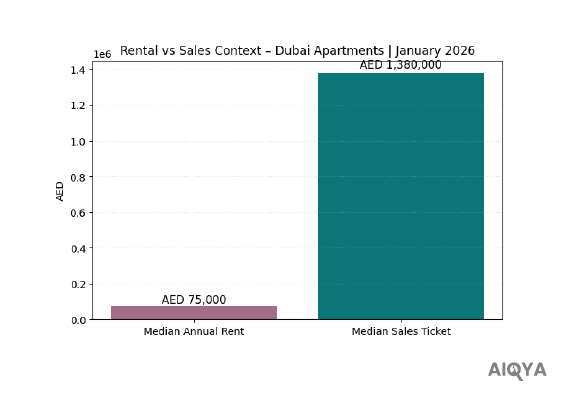
What January rentals suggest (Residential | Freehold | Units)
- Median annual rent: ~AED 75,000
- Median rent intensity: ~AED 98 per sq ft per year
(annual rent divided by area)
📝 Interpretation
These medians point to a leasing market that remains range-bound. Nothing here suggests a sudden rental shock in either direction. That steadiness matters, because it supports the sales market’s liquidity bands: when rentals remain stable, investor demand for compact units stays easier to justify, and end-user decisions are less pressured by runaway monthly outflows.
Yield outlook (directional, not a “precision” yield table)
Using the January medians as a broad anchor (not configuration-level), the implied gross yield sits around ~5.4%:
- ~AED 75k median annual rent ÷ ~AED 1.38m median sales ticket ≈ ~5.4%
🧭 AIQYA Insight
Treat this as a temperature reading, not a diagnosis. January yields are heavily influenced by mix, renewals, and lease versions. The useful takeaway is the relationship: rents appear steady enough to keep the investor logic intact in the sub-AED 2m market, without signalling an overheated tenant environment.
Important data note (kept transparent)
- Rental records show system/renewal duplication patterns (normal for Ejari-style datasets).
- Project naming is often missing, so we avoid project-wise rental rankings.
- Configuration (Studio/1BR/2BR) is not consistently available for units in the rental file, so we do not publish config-wise rental medians for January.
Hotel Apartments (rental lens)
Hotel apartment rentals do not surface cleanly as a tagged segment in this rental file, so we will keep hotel apartment rental commentary qualitative only. Their sales behaviour still reads as a structured-income product, but we won’t force numeric rental alignment where tagging is weak.
Configuration Spotlight
| Project-wise Breakdown | January 2026
This is where the month becomes tangible. The configuration mix tells us what moved; the project-wise split tells us where that demand actually landed. January’s story is clear: compact units were not just popular in theory; they were concentrated in a handful of repeatable, high-absorption projects.
Studio | Liquidity Engine Hotspots
Studios were heavily concentrated, with one project acting as a clear volume magnet.
Top studio projects:
- Binghatti Vintage (289)
- Binghatti Cullinan (103)
- Samana Boulevard Heights (66)
- Breez by Danube (44)
- Hadley Heights 2 (42)
🧭 AIQYA Insight
When studios cluster this tightly, it usually points to a familiar Dubai pattern: standardised unit logic + investor-friendly pricing + repeat buyer comfort. This is liquidity behaving like a lane, not a scatter.
1BR | The Market’s Mainstream Workhorse
1BRs carried the bulk of January’s volume, and the leaders were a mix of branded series and community-staple supply.
Top 1BR projects:
- DAMAC Riverside Views – Azure 2 (102)
- Hado By Beyond (98)
- Creek Haven (82)
- Creek Bay (78)
- Windsor House (73)
📝 Interpretation
This is the clearest “bread-and-butter” segment. When 1BRs lead, it usually means the market is moving with broad investor participation plus upgrader demand.
2BR | The Family-leaning Volume Segment
2BR demand was distributed, but a few projects clearly led absorption.
Top 2BR projects:
- Nourelle (81)
- Terra Gardens (66)
- Windsor House (65)
- Palace Residences Hillside A (63)
- Hado By Beyond (57)
🧭 AIQYA Insight
2BRs often sit at the intersection of investor logic and end-user liveability. When this segment holds meaningful volume, it usually signals stable mid-market confidence rather than speculative churn.
3BR | Selective Trading, Not Mass Absorption
3BR volumes were thinner and more “choice-based” than “market-led”.
Top 3BR projects:
- Nourelle (40)
- Silva (19)
- Palm Central Private Residences – Frond M (18)
- Hado By Beyond (18)
- Creek Bay (17)
📝 Interpretation
This is the lifestyle ballast segment: fewer transactions, but often higher intent. These homes move when the unit is distinct enough to justify the premium.
3BR+ | Ultra-thin, Premium-specific
As expected, 3BR+ is small in volume and highly project-specific.
Top 3BR+ projects:
- Palm Central Private Residences – Frond M (9)
- Avarra by Palace (5)
- Solaya (1,2,3) (4)
- Soulever’ By Beyond (3)
- (Then a long tail of projects with 2 deals each)
Hotel Apartments | A Parallel Segment (within residential units)
Hotel apartments are included but behave differently, so they deserve a clean, separate lens.
Top hotel apartment projects:
- Biltmore Sufouh (20)
- AYKON City (16)
- The Address Residence – Sky View (8)
- Address Residence / Fountain Views variants (7–7–6 range)
- Arian by Azizi (6)
- Azizi Star Hotel Apartments (6)
🧭 AIQYA Insight
This is a brand-and-operator led micro-market. It behaves more like “managed product demand” than conventional residential selection, which is why we keep it out of affordability and end-user conclusions.
Risks & Watchpoints
Every month has a few traps that can make a market look hotter, softer, richer, or cheaper than it really is. January has its own set of distortions, mostly driven by mix and early-year timing. Calling these out keeps the narrative honest, and prevents readers from over-reading a single month.
1) Composition risk: off-plan heavy months can “fake” stability
With off-plan driving the majority of January activity, medians are heavily influenced by:
- Launch pricing
- Unit mix (more compact units)
- Payment plan structures
📝 Interpretation
A stable citywide median does not automatically mean prices are flat everywhere. It often means the market is transacting within a familiar product mix.
2) Launch skew: a few projects can pull volume without representing the city
Even though overall concentration is not excessive, the top projects still create narrative gravity. High-absorption projects can make a locality or developer feel like the whole market.
🧭 AIQYA Insight
In Dubai, the “headline projects” are often a market within the market. They’re important signals, but not a substitute for citywide health.
3) Unit size compression: liquidity can come at the cost of liveability
January’s compact unit dominance keeps liquidity healthy, but it also means:
- Smaller sizes can inflate AED/sq ft
- End-user comfort can diverge from investor liquidity
📝 Interpretation
This is not a red flag. It’s a reminder that psf benchmarks should be read alongside size and ticket, especially in studio-heavy months.
4) Hotel apartments: a different asset class inside a residential wrapper
Hotel apartments are included, but they behave differently:
- Driven by managed-income logic
- Brand/operator influence
- A distinct buyer profile
🧭 AIQYA Insight
They should be treated as a parallel signal. If blended into affordability or end-user reads, they distort the story.
5) Rental data limitations: good for context, weak for precision
Rental records show normal renewal/version repetition and often lack clean project naming. Configuration tagging is inconsistent for units.
📝 Interpretation
Rental data is useful to validate stability, but not to publish granular yield tables for a single month.
6) Single-month risk: January is a baseline, not a trend
January can reflect:
- Year-begin reset behaviour
- Developer launch calendar timing
- Investor re-entry after year-end cycles
🧭 AIQYA Insight
January should be treated as a reference frame. The real signal strengthens when February and March confirm whether these patterns persist or fade.
Supply Snapshot
| What’s in the Pipeline
Supply in Dubai is rarely a background variable. It is the stage on which demand performs. January’s dataset does not directly quantify future completions, but it offers a reliable proxy for supply direction through two lenses: off-plan dominance and project concentration patterns. Together, they indicate what kind of inventory is being absorbed most efficiently, and therefore what kind of inventory is likely to keep coming.
What January suggests about incoming supply
- Off-plan forms the bulk of activity, which means a large share of transactions are effectively bookings against future delivery timelines.
- The project leaderboard is populated by repeatable, mid-ticket developments, indicating that supply absorption is strongest where pricing and layouts align with broad buyer demand.
- Configuration mix leans heavily toward studios, 1BRs, and 2BRs, suggesting that the near-term pipeline continues to be optimised around compact units and investor-friendly ticket bands.
📝 Interpretation
The supply being absorbed in January is not “luxury-first”. It is liquidity-first. That points to a pipeline designed to keep transaction volumes healthy: compact units, packaged pricing, and phased project series that can be sold repeatedly.
Where supply signals feel strongest
January’s top-volume projects and the dominance of compact configurations imply:
- A continued stream of high-density apartment stock
- Payment-plan-led launch cycles
- A long tail of projects absorbing smaller volumes, which is typical of a market with wide choice
🧭 AIQYA Insight
A market like this does not move on scarcity. It moves on product fit. January shows that supply is being priced and sized for a broad demand base, which supports liquidity. The watchpoint is not oversupply in general; it is misaligned supply: projects that miss the affordability bands and unit logic that buyers are repeatedly choosing.
Hotel apartments as a supply sub-signal
Hotel apartment transactions, though small in share, indicate that operator-led inventory continues to find buyers. This tends to expand in phases, often aligned with tourism economics and branded positioning rather than conventional residential demand.
Final Observations & Buyer Takeaways
January does not read like a market at an inflection point. It reads like a market finding its footing. Activity was broad, pricing stayed disciplined, and buyer behaviour followed familiar patterns rather than impulsive ones. In many ways, this is exactly what a healthy opening month looks like.
What January tells us, in plain terms
- Liquidity is intact. Compact apartments, especially studios and 1BRs, continue to move efficiently. This keeps the transaction engine running and supports price stability.
- Off-plan remains the organising force. Payment plans and phased commitments are shaping buyer decisions more than urgency or fear of missing out.
- Premium demand exists, but selectively. Larger homes and higher-ticket purchases are present, but they behave like conviction buys, not mass absorption plays.
- Rentals are steady enough to support the sales logic. No visible stress on tenant affordability means investor assumptions are not being undermined in the short term.
📝 Interpretation
January’s numbers suggest a market that is measured rather than emotional. Buyers are choosing structure, flexibility, and product fit over speed. That tends to produce stable medians and wide participation, rather than sharp spikes or pullbacks.
Buyer Takeaways
For Investors
- The sub-AED 2m segment continues to offer the best balance of entry price and liquidity.
- Studios and 1BRs remain the easiest to trade, but size efficiency matters more than headline psf.
For End-Users
- Ready homes offer better spatial value in select pockets, especially where unit sizes are larger than newer off-plan supply.
- Patience pays. January shows choice, not shortage.
For Upgraders
- Off-plan structures remain an effective way to plan a phased move-up without immediate capital pressure.
- Look for projects where layout quality and delivery track record justify the wait.
For Hotel Apartment Buyers
- This remains a niche, operator-driven segment. Buy it for structure and management, not for typical residential appreciation logic.
🧭 AIQYA Closing Insight
January 2026 sets a credible baseline. It neither inflates expectations nor undermines confidence. As February and March data arrive, the real story will be whether this balance holds or whether one segment begins to pull away. Until then, January stands as a reference month: calm, liquid, and structurally sound.
Data Source & Method Note
Figures are based on Dubai Land Department-registered sales transactions for January 2026 and registered lease contracts for the rental context.
Scope: Residential, Freehold, Apartments only (Flats + Hotel Apartments).
Included procedures: Sale, Sell – Pre-registration, Sale on Payment Plan.
Excluded: Villas, townhouses, land, buildings, commercial assets, mortgages, gifts, delayed sales, and lease-to-own.
Pricing metric: Median of transaction value divided by actual area (sqm converted to sq ft).
Deduplication: Transaction Number + Project Name + Registration Date + Area.
Rental indicators are used directionally and are not intended for granular yield benchmarking.
Disclaimer
Figures are derived from official registered datasets. Minor gaps may exist due to naming inconsistencies or registration classifications. This report is intended for insight and education and does not constitute financial or investment advice.