
Dubai villa market April 2026 reflects stable demand, measured transaction activity, and a segment shaped more by end-user decisions than short-term market cycles.
For a broader view of the apartment-led market, see our analysis on Dubai Residential Market – April 2026.
Apartments are traded. Villas are chosen.
Market Overview
While apartments capture the movement of Dubai’s property market, villas tend to reveal something more stable beneath it.
April was a month of heightened attention. Transaction spikes, shifting sentiment, and questions around market direction shaped the broader narrative. Within the villa segment, that intensity is largely absent.
There are no sharp inflections in the data. No visible surge, and no clear withdrawal. Activity remains measured. A total of 906 transactions, anchored by a median ticket of AED 4.03 million, points to a segment where decisions are taken with more deliberation and less immediacy.
Pricing adds another layer. At AED 1,862 per square foot, villas sit close to apartment pricing on a per-unit basis. Yet the behaviour behind these numbers is very different. The similarity in price does not translate into similarity in intent.
Apartments tend to respond quickly to shifts in capital and sentiment. Villas move more slowly, shaped by factors that sit outside short-term market cycles — space requirements, family transitions, and long-term living decisions.
That difference shows up quietly.
Apartments are traded.
Villas are chosen.
Key Market Metrics
The villa segment operates on a smaller base of transactions, but each carries significantly higher capital weight. Volume provides context, but distribution and ticket size define the market.
Core Metrics – April 2026 (Villas)
| Metric | Value |
| Transactions | 906 |
| Median Price (AED/sqft) | 1,862 |
| Median Ticket (AED) | 4.03M |
| Off-Plan Share | 76.1% |
| Ready Share | 23.9% |
At just over 900 transactions, villas form a smaller share of overall activity, but the median ticket places the segment firmly within a mid-to-premium bracket. The capital commitment required here naturally filters participation.
Off-plan activity remains dominant, though lower than apartments. The ready segment holds a more visible share, reflecting a stronger inclination toward immediate use rather than purely forward-looking commitments.
Price per square foot aligns broadly with apartment levels, but the similarity is superficial. In villas, pricing is only one part of the decision. Layout, community, and long-term suitability carry equal weight, making transactions less sensitive to short-term market signals.
Taken together, the metrics point to a segment that operates with a different rhythm, where participation is shaped more by need than by timing.
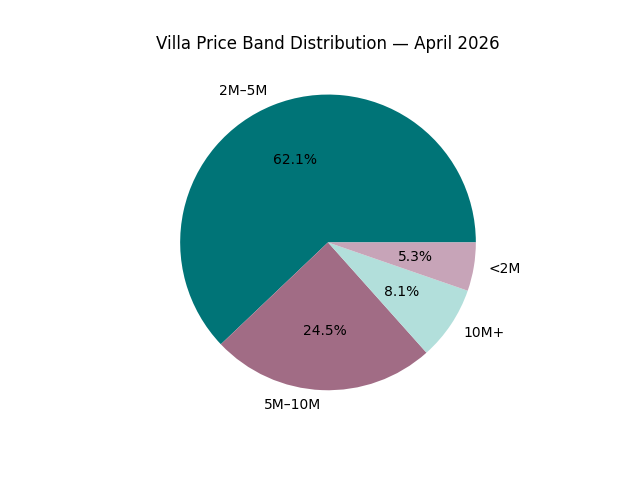
Villa Price Band Distribution – April 2026
Affordability Snapshot – Where Capital Sits
In the villa segment, affordability does not stretch across a wide spectrum. It concentrates within a narrower, higher-value band where demand and supply remain aligned.
Price Band Distribution – Villas (April 2026)
| Price Band | Share % |
| AED 2M – 5M | 62.1% |
| AED 5M – 10M | 24.5% |
| AED 10M+ | 8.1% |
| < AED 2M | 5.3% |
Nearly 87% of all transactions fall between AED 2M and 10M, establishing this as the segment’s core operating range. Activity below AED 2M is limited, while transactions above AED 10M remain selective.
Unlike apartments, where demand stretches across multiple tiers, villa activity holds within a compressed premium band. The market is not expanding upward or downward. It remains anchored within a defined range.
Within this band, a progression is visible.
- AED 2M–5M reflects entry into villa living
- AED 5M–10M captures more established households
- Above AED 10M remains selective and discretionary
The market moves within boundaries rather than across them. Pricing does not stretch easily because it is closely tied to who the buyer is and where they are in their housing journey.
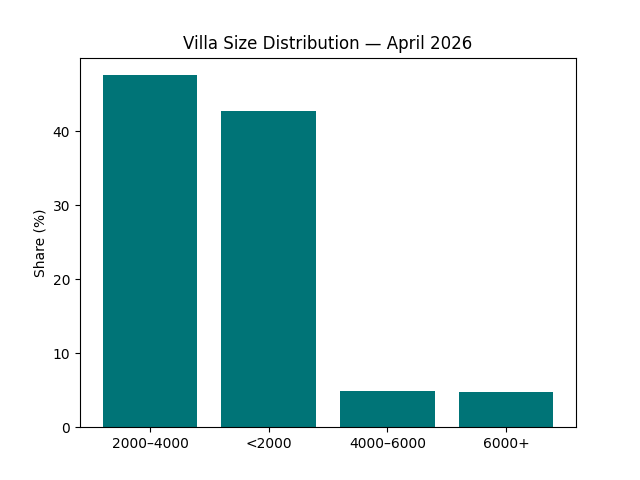
Villa Size Distribution – April 2026
Unit Size Trends & Market Signals
If price defines entry into the villa market, size reflects how that capital is translated into living space.
Villa Size Distribution – April 2026
| Size Band (sqft) | Share % |
| 2000 – 4000 | 47.6% |
| < 2000 | 42.8% |
| 4000 – 6000 | 4.9% |
| 6000+ | 4.8% |
Over 90% of transactions fall below 4,000 sqft, indicating a clear preference for mid-sized formats. The market is no longer centred around expansive homes.
This is not a reduction in demand for villas. It is a shift in how space is valued.
Buyers are choosing homes that offer sufficient space without excess, are easier to maintain, and sit within defined capital bands.
The relationship between size and price is direct.
- Sub-2000 sqft aligns with the AED 2M–5M range
- 2000–4000 sqft forms the core of the market
- Larger formats move into higher price brackets where demand becomes selective
What emerges is a more efficient use of space. Villas remain an upgrade from apartments, but the emphasis is shifting from scale to suitability.
Top Areas & Development Activity
Villa demand does not spread evenly across the city. It clusters around zones where land, infrastructure, and new supply come together.
Top Demand Areas – Villas (April 2026)
| Area | Transactions |
| Al Yelayiss 1 | 268 |
| Saih Shuaib 1 | 246 |
| Madinat Al Mataar | 37 |
| Wadi Al Safa 5 | 33 |
| Al Yufrah 1 | 27 |
The top two areas alone account for a significant share of activity, indicating that the market is being shaped by specific development corridors rather than broad city-wide demand.
Villas require larger land parcels, planned community layouts, and phased development. As a result, demand follows where these conditions are met.
Emerging zones with active masterplans attract volume, while established villa communities show steadier, lower turnover.
High-activity areas typically align with:
- Mid-sized villas within the AED 2M–5M band
- Community-led developments
- Phased supply entering in batches
Over time, this creates a layered market.
- Emerging corridors drive volume
- Established communities provide stability
- Premium enclaves see selective, low-frequency transactions
The result is not a single map, but a set of active pockets at different stages of growth.
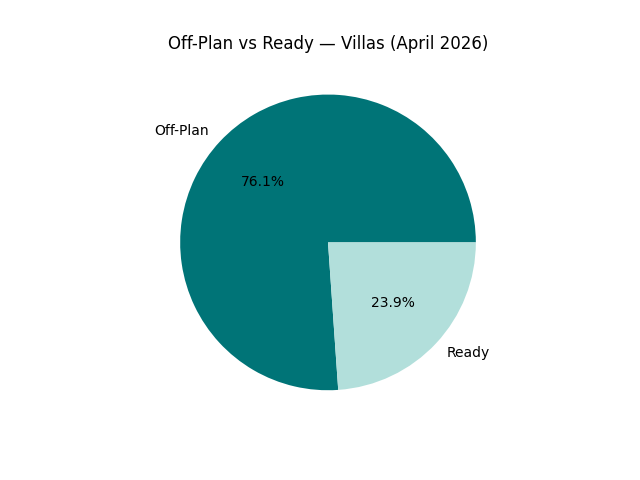
Off-plan vs Ready – Villas (April 2026)
Primary vs Secondary Market Composition
The villa market continues to be led by off-plan transactions, though the balance between new and ready properties is more even than in apartments.
Off-Plan vs Ready – Villas (April 2026)
| Segment | Share % |
| Off-Plan (Primary) | 76.1% |
| Ready (Secondary) | 23.9% |
Off-plan accounts for over three-quarters of activity, reflecting the role of developer-led supply. At the same time, the ready segment holds a more visible share.
This changes how the market behaves.
In apartments, off-plan activity is often tied to investment entry and payment plan structures. In villas, decisions shift toward immediate usability, built quality, and community readiness.
The presence of completed inventory allows buyers to evaluate what they are purchasing more directly. For many, this reduces uncertainty and aligns better with the nature of the decision itself.
The gap between villas and apartments is not large, but it is meaningful. Villas maintain a stronger link to present conditions, resulting in a more balanced structure.
Buyer Profile & Demand Lens
The villa market is defined less by volume and more by intent.
Participation is anchored in end-users and upgraders, with investor presence remaining selective. The higher capital commitment naturally limits speculative entry.
Demand Structure – Villas (April 2026)
| Buyer Type | Behaviour |
| End-users | Primary drivers |
| Upgraders | Strong participation |
| Investors | Limited, selective |
Most transactions are linked to life-stage transitions rather than market timing. Buyers are moving into larger homes, upgrading space, or consolidating long-term living decisions.
This also changes how decisions are made.
- Apartments are evaluated on yield, entry price, and exit flexibility
- Villas are evaluated on layout, community, and long-term suitability
The emphasis shifts from financial optimisation to lifestyle alignment. Demand remains steady not because it expands, but because it holds.
The market does not react quickly. It absorbs change over time.
Final Observations & Buyer Takeaways
The villa market does not move with the same rhythm as apartments.
There is no visible surge, but more importantly, no sign of retreat. Transaction volumes remain measured, pricing holds within its established range, and demand continues to concentrate within defined size and price bands.
It does not react quickly.
It absorbs change over time.
What stands out is consistency.
- Demand remains anchored in end-users and upgraders
- Capital continues to sit within the AED 2M–10M range
- Mid-sized villas form the core of the market
- The ready segment retains a meaningful role
These are structural patterns, not short-term shifts.
Buyer Takeaways
For End-Users
- The 2000–4000 sqft segment remains the most active
- Emerging corridors offer the widest range of supply
- Decisions should prioritise community, layout, and long-term fit
For Upgraders
- The AED 5M–10M range reflects stable upgrade demand
- Larger formats exist, but transaction depth is thinner
- Focus remains on product quality and location
For Investors
- Participation remains selective
- Yield is not the primary driver
- Positioning tends to be long-term
Closing Note
If apartments define the pace of Dubai’s property market, villas define its stability.
They do not lead the cycle.
They anchor it.
Data Source Attribution
This report is based on official transaction records sourced from:
- Dubai Land Department (DLD) — Residential Freehold Transactions (April 2026)
Scope & Filters Applied
To maintain consistency with AIQYA’s reporting framework, the following filters were applied:
- Property Type: Villas & Townhouses
- Ownership: Freehold
- Usage: Residential only
- Exclusions:
- Apartments, plots, commercial assets
- Offices, retail, hotel rooms
- Mortgage records, gifts, grants, and non-sale transfers
- Sales Procedures Included:
- Sale
- Sell – Pre-registration
- Sale on Payment Plan
Data Processing Methodology
- Deduplication:
Transactions were deduplicated using a composite key of:
Unit + Project Name + Registration Date + Area - Price Calculation:
Median price per square foot calculated as:
Transaction Value ÷ (Actual Area × 10.7639) - Unit Size Conversion:
Areas recorded in square meters were converted to square feet for analysis. - Price Banding:
Transactions were grouped into standard ticket ranges for distribution analysis.
Notes on Interpretation
- Villa transactions typically show:
- Lower volume
- Higher ticket variation
- Greater sensitivity to location and community
- Project and community names have been standardised where necessary to address minor variations in spelling and formatting.
Disclaimer
Figures are based on officially registered datasets. Minor gaps may exist due to naming inconsistencies, reporting delays, or classification exclusions. This report is intended for insight and education purposes only and does not constitute financial advice.
Continue Your Research:
Dubai Residential Market – April 2026 (Apartments)
The Myth of Panic Selling in Dubai Real Estate
Why Dubai Property Prices Don’t Correct Easily