Dubai residential property market April 2026 reflects a market that absorbed attention without losing structure.
- Market Overview
- Key Market Metrics
- Price Trends & Market Interpretation
- Primary vs Secondary Market Composition
- Configuration Distribution – What Buyers Are Choosing
- Unit Size Trends & Market Signals
- Top Projects & Developer Activity
- Affordability Snapshot – Where Buyers Are Spending
- Buyer Profile & Demand Lens
- Rental Trends & Yield Outlook (Freehold Residential)
- Configuration Spotlight – Project-Level Breakdown
- Risks & Watchpoints
- Supply Snapshot – What’s in the Pipeline
- Observations & Buyer Takeaways
- Data Source Attribution
Market Overview
April was expected to test the market. What it revealed instead was how firmly it is anchored.
The first half of the month saw a visible acceleration in activity, drawing attention to how quickly sentiment can translate into transactions in Dubai’s residential market. The full-month data, however, tells a more measured story. The initial momentum did not reverse. It settled into a familiar pattern.
Transaction volumes closed at 10,677 residential apartment sales, broadly in line with the quarterly run rate. Price levels did not soften through this phase. The median price rose to AED 1,865 per square foot, while the median transaction value moved up to AED 1.52 million, both higher than Q1 benchmarks.
What shifted was not direction, but pace.
The mid-April window, with 5,297 transactions in just 15 days, reflected a front-loaded phase of activity, with higher ticket sizes and elevated price levels. By the end of the month, the market had normalised, not declined. This distinction is important. It indicates absorption rather than withdrawal.
April 2026 – Market Snapshot (Residential Freehold Apartments)
| Metric | April 2026 | Mid-April (1–15) | Q1 2026 |
| Transactions | 10,677 | 5,297 | 33,943 (quarter) |
| Median Price (AED/sqft) | 1,865 | 1,937 | 1,755 |
| Median Ticket (AED) | 1.52M | 1.67M | 1.39M |
| Off-Plan Share | 82.5% | 100%* | 75.6% |
*Mid-April dataset is predominantly off-plan.
📝 Interpretation
The numbers reflect a market that experienced a front-loaded surge, followed by stabilisation. Prices and ticket sizes remained elevated relative to Q1, indicating continued strength rather than correction.
The internal composition of the market further reinforces this stability. Off-plan transactions increased their share to 82.5 percent, highlighting continued reliance on developer-led supply. At the same time, demand remained concentrated within the 500 to 1500 square foot range, which accounted for the majority of transactions, reflecting a balanced preference between compact and mid-sized homes.
This is not a market narrowing into defensive positions. It is a market continuing to operate within its most efficient segments.
🧭 AIQYA Insight
April does not signal a turning point. It reveals a pattern.
- Activity accelerates when attention rises
- Pricing holds through the cycle
- Demand remains anchored in liquid, mid-sized configurations
Markets that are fragile tend to correct quickly. Markets that are structured tend to absorb and stabilise. April aligns with the latter.
Key Market Metrics
With the dataset now locked, April’s numbers can be read without approximation. What emerges is not volatility, but a market operating within clearly defined parameters.
Core Metrics – April 2026
| Metric | Value |
| Total Transactions | 10,677 |
| Median Price (AED/sqft) | 1,865 |
| Median Ticket (AED) | 1.52M |
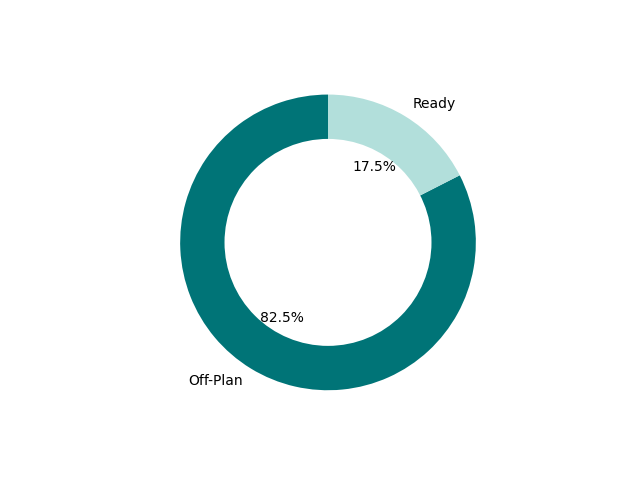
| Off-Plan Share | 82.5% |
| Ready Share | 17.5% |
📝 Interpretation
The market remains strongly anchored in off-plan activity, with over four-fifths of transactions driven by primary sales. Median price and ticket levels both show an upward shift compared to the Q1 baseline.
Market Composition – Configuration Split
| Configuration | Share % |
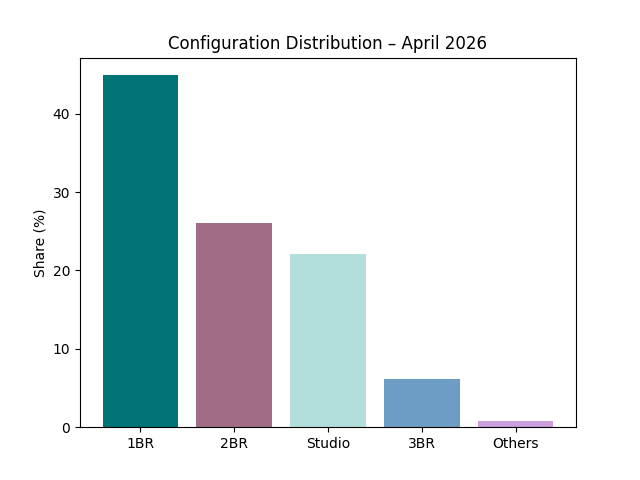
| 1 Bedroom | 44.9% |
| 2 Bedroom | 26.0% |
| Studio | 22.1% |
| 3 Bedroom | 6.2% |
| Others | 0.8% |
📝 Interpretation
The dominance of one-bedroom units reinforces their role as the market’s primary liquidity segment. Two-bedroom homes continue to provide stability, while studios maintain a strong but secondary position.
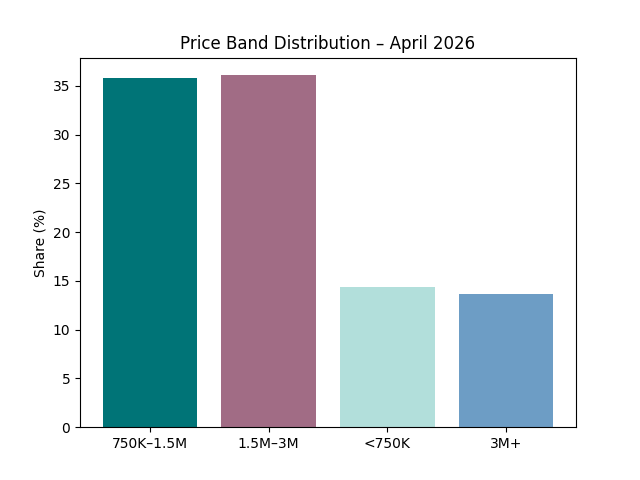
Price Band Distribution – Where Capital Flows
| Price Band | Share % |
| AED 1.5M – 3M | 36.1% |
| AED 750K – 1.5M | 35.8% |
| < AED 750K | 14.4% |
| AED 3M+ | 13.7% |
📝 Interpretation
Nearly three-quarters of all transactions fall within the AED 750K to 3M range, confirming this as the market’s central operating band. Higher-value transactions continue, but without expansion in share.
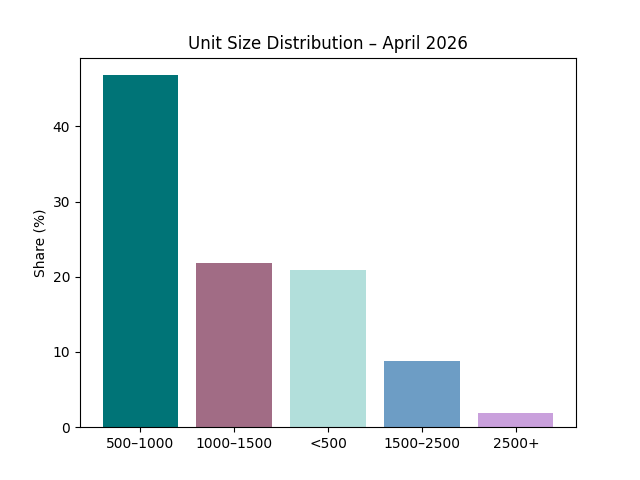
Unit Size Distribution – Actual Spatial Demand
| Size Band (sqft) | Share % |
| 500 – 1000 | 46.8% |
| 1000 – 1500 | 21.8% |
| < 500 | 20.9% |
| 1500 – 2500 | 8.8% |
| 2500+ | 1.9% |
📝 Interpretation
The majority of demand sits within the 500–1500 sqft range, indicating a strong preference for efficient, mid-sized homes. Very large units form a small but consistent layer of the market.
Top Demand Areas – April Concentration
| Area | Transactions |
| Madinat Al Mataar | 919 |
| Jumeirah Village Circle | 770 |
| Palm Deira | 662 |
| Dubai Land Residence Complex | 581 |
| Al Hebiah Fifth | 559 |
| Jabal Ali First | 518 |
| Al Khairan First | 517 |
| Business Bay | 318 |
| Al Satwa | 311 |
| Jumeirah Village Triangle | 271 |
📝 Interpretation
Transaction activity is concentrated across a mix of emerging corridors and established investor zones, reflecting both new supply absorption and continued demand in familiar micro-markets.
🧭 AIQYA Insight
The metrics point to a market that is neither expanding aggressively nor contracting defensively. It is operating within a defined structure:
- Off-plan drives volume
- 1BR and 2BR units anchor liquidity
- AED 750K–3M remains the core capital band
- Mid-sized homes dominate spatial demand
This is not a market searching for direction. It is a market functioning within it.
Price Trends & Market Interpretation
April does not present a confused price story. It presents a clear one, once the data is read without distortion.
Prices moved up.
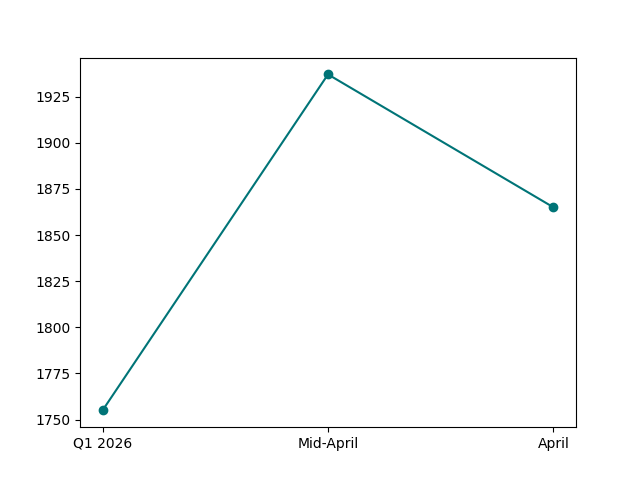
From a Q1 median of AED 1,755 per square foot, April closes at AED 1,865 per square foot, marking a measurable upward shift. The movement is not abrupt, but it is consistent. More importantly, it holds through the full month, even after the elevated activity seen in early April.
Price Movement – Q1 vs April
| Period | Median Price (AED/sqft) | Median Ticket (AED) |
| Q1 2026 | 1,755 | 1.39M |
| April 1–15 | 1,937 | 1.67M |
| April Full Month | 1,865 | 1.52M |
📝 Interpretation
The mid-April window shows a clear spike in both price and ticket size, indicating a phase of accelerated, higher-value transactions. The second half of the month moderates from this peak, but does not fall below the Q1 baseline.
This is where the distinction becomes important.
The market did not correct after the early surge. It stabilised at a higher level.
The difference between a correction and a stabilisation is subtle, but critical. A correction implies a reversal of price direction. Stabilisation suggests that the market absorbed a short-term surge and reset at a sustainable level.
April reflects the latter.
🧭 AIQYA Insight
Dubai’s pricing behaviour is not purely reactive. It is structured.
- Off-plan pricing is anchored by developers, not negotiated transaction by transaction
- Payment plans distribute commitment over time, reducing immediate price pressure
- Demand is channelled into defined price bands rather than dispersed across the market
This reduces the likelihood of sudden downward price discovery.
Price Structure – Where Strength Holds
| Observation | Signal |
| Price increase from Q1 to April | Upward momentum intact |
| Mid-April spike | Front-loaded high-value activity |
| Late-April moderation | Stabilisation, not decline |
| Strong off-plan share (82.5%) | Developer pricing discipline |
📝 Interpretation
The upward movement in price is supported by both transaction data and market structure. It is not an outlier created by a few high-ticket deals, but a broad-based shift reinforced by continued participation.
There is also a deeper layer to how price behaves in this market.
In many global markets, uncertainty translates into price negotiation. In Dubai, it more often translates into where buyers choose to participate, rather than how much they pay per square foot. April reflects this distinction clearly.
Buyers adjusted timing and entry points. They did not force price corrections.
🧭 AIQYA Insight
Price is not the first lever that moves in Dubai’s market.
Participation is.
When conditions shift:
- Activity may accelerate or moderate
- Capital may move across segments
- But pricing tends to hold, supported by structured supply and controlled release
April reinforces this hierarchy.
Primary vs Secondary Market Composition
April reinforces a pattern that has defined Dubai’s residential market in recent years. The primary market continues to dominate, not just in share, but in how transactions are initiated and absorbed.
Off-Plan vs Ready – April 2026
| Segment | Share of Transactions |
| Off-Plan (Primary) | 82.5% |
| Ready (Secondary) | 17.5% |
📝 Interpretation
More than four out of every five transactions in April are off-plan. This is a clear increase from the 75.6% share recorded in Q1, indicating that primary market activity has strengthened rather than weakened.
Trend Comparison – Q1 vs April
| Period | Off-Plan Share | Ready Share |
| Q1 2026 | 75.6% | 24.4% |
| April 2026 | 82.5% | 17.5% |
📝 Interpretation
If there were a shift toward resale-driven activity, it would reflect here. The data shows the opposite. The ready market’s share has reduced, while off-plan transactions have expanded.
This directly challenges a widely circulating perception.
In investor conversations and informal channels, April was often described as a phase of caution, with references to slower luxury activity, quieter high-end consumption, and even suggestions of distress-driven selling. While such observations may capture sentiment at the margins, they do not reflect the transaction base.
🧭 AIQYA Insight
Panic selling, if present, would manifest as:
- A sharp rise in ready transactions
- A visible shift away from off-plan commitments
- Price undercutting in resale-heavy segments
None of these are evident in the data.
Instead, what April shows is a market that continues to operate through its primary channel. Off-plan transactions remain the entry point for most buyers, supported by:
- Structured payment plans
- Developer-controlled pricing
- Phased inventory release
These mechanisms reduce the likelihood of sudden reversals in participation.
Segment Behaviour – April Pattern
| Observation | Signal |
| Off-plan share increased to 82.5% | Strong primary market momentum |
| Ready market share declined | No shift to resale-led activity |
| Price levels held and increased | No distress pricing |
| Transaction volumes stable | No withdrawal of demand |
📝 Interpretation
The market did not pivot toward defensive behaviour. It continued to transact within the same structure, with increased reliance on developer-led supply.
There is also a behavioural nuance here.
The ready market typically reflects:
- End-user purchases
- Immediate occupancy demand
- Select investor resale activity
Its relative stability, even with a lower share, suggests that end-user demand has not weakened significantly. Rather, it has been outpaced by stronger off-plan participation.
🧭 AIQYA Insight
Dubai’s market does not swing between primary and secondary. It operates with both, but at different scales and speeds.
- Off-plan drives momentum
- Ready market provides continuity
April does not disrupt this relationship. It reinforces it.
Configuration Distribution – What Buyers Are Choosing
If pricing and market composition explain how the market is structured, configuration reveals how buyers are choosing to participate within that structure. April’s distribution is precise and consistent with a market that prioritises liquidity without abandoning usability.
Configuration Split – April 2026 (Apartments)
| Configuration | Share % | Market Role |
| 1 Bedroom | 44.9% | Core liquidity segment |
| 2 Bedroom | 26.0% | Balanced end-user + investor |
| Studio | 22.1% | Entry-level access |
| 3 Bedroom | 6.2% | Lifestyle / family segment |
| Others | 0.8% | Limited participation |
📝 Interpretation
One-bedroom units form nearly half of all transactions, clearly establishing them as the market’s dominant configuration. Two-bedroom homes maintain a stable second layer, while studios continue to provide strong entry-level access. Larger homes remain present, but with a narrower share.
This distribution is not unusual. What is notable is how firmly it holds, even in a month where sentiment was under observation.
There is no visible shift toward ultra-compact units. Studios account for just over one-fifth of transactions, indicating that buyers are not compressing aggressively into the lowest ticket segment. At the same time, the share of larger homes has not expanded, suggesting that higher-value commitments remain selective.
What emerges is a balanced centre.
🧭 AIQYA Insight
The market’s true liquidity engine is not studios. It is one-bedroom homes.
They sit at the intersection of:
- Affordability
- Rental demand
- Exit flexibility
Two-bedroom homes extend this logic into the end-user space, offering a combination of livability and investment potential. Together, these two configurations account for over 70% of all transactions, forming the operational core of the market.
Configuration Behaviour – April Pattern
| Segment | Behaviour | Signal |
| 1BR | Dominant (44.9%) | Primary liquidity driver |
| 2BR | Stable (26.0%) | Market balance |
| Studios | Strong (22.1%) | Entry activity |
| 3BR+ | Limited (6.2%) | Selective demand |
📝 Interpretation
Buyers are not shifting dramatically between configurations. Instead, they are reinforcing the segments that already offer the highest efficiency in terms of pricing, rental potential, and resale flexibility.
There is also an alignment between configuration and price bands. The dominance of one- and two-bedroom units corresponds directly with the AED 750K to 3M range, where the majority of transactions are concentrated. This reinforces the idea that configuration choice is closely tied to capital allocation rather than purely lifestyle considerations.
🧭 AIQYA Insight
Configuration distribution is where behaviour becomes visible.
April shows a market that remains disciplined:
- Not overextending into larger homes
- Not retreating into ultra-compact units
- But operating within a defined, efficient middle
This is not contraction. It is consistency.
Unit Size Trends & Market Signals
Configuration tells us what buyers are choosing. Unit size shows how much space they are committing to. In April, the two align closely, revealing a market that is centred around efficiency rather than extremes.
Unit Size Distribution – April 2026 (Apartments)
| Size Band (sqft) | Share % | Market Role |
| 500 – 1000 | 46.8% | Core transaction band |
| 1000 – 1500 | 21.8% | End-user + upgrade segment |
| < 500 | 20.9% | Entry-level / compact |
| 1500 – 2500 | 8.8% | Family-sized homes |
| 2500+ | 1.9% | Premium / luxury |
📝 Interpretation
Nearly 68% of all transactions fall within the 500–1500 sqft range, establishing this as the market’s spatial core. Sub-500 sqft units remain significant but do not dominate, while larger homes account for a smaller, steady share.
This distribution clarifies an important point.
April is not a story of downsizing. Buyers are not moving sharply toward smaller homes. Instead, they are operating within a defined band of efficient unit sizes that balance cost, usability, and flexibility.
The dominance of the 500–1000 sqft segment aligns directly with the strength of one-bedroom units, while the 1000–1500 sqft range reflects continued demand for well-sized two-bedroom homes. Together, these segments form the backbone of transaction activity.
🧭 AIQYA Insight
Unit size acts as a proxy for how capital is being deployed.
- Smaller units offer liquidity and faster turnover
- Mid-sized units provide balance between investment and end-use
- Larger homes require longer-term commitment and therefore move more selectively
April reinforces this hierarchy.
Size vs Market Behaviour – April Pattern
| Observation | Signal |
| 500–1000 sqft dominance (46.8%) | Core liquidity zone |
| Strong 1000–1500 sqft share (21.8%) | Stable end-user demand |
| Limited large-format transactions | Selective capital deployment |
📝 Interpretation
The distribution suggests that buyers are not reducing their spatial expectations. They are participating in segments where price, usability, and resale potential remain aligned.
There is also a structural link between size and pricing.
The concentration of transactions in the 500–1500 sqft range corresponds directly with the AED 750K–3M price band, where the majority of capital is deployed. This reinforces the idea that spatial decisions are closely tied to affordability thresholds and market liquidity.
🧭 AIQYA Insight
Dubai’s market does not polarise easily between compact and luxury extremes.
It operates around a functional middle, where:
- Units are large enough to be livable
- Small enough to remain liquid
- Priced within the most active capital band
April does not shift this balance. It confirms it.
Top Projects & Developer Activity
April’s market is not evenly distributed. A significant share of transactions is concentrated within a relatively small set of projects, reflecting how supply is introduced and absorbed in Dubai.
This concentration is not incidental. It is a direct outcome of launch cycles, pricing strategy, and payment structuring.
Top Transacting Projects – April 2026
| Project | Transactions | Developer (Indicative) |
| DAMAC Lagoons – Valencia | 529 | DAMAC |
| Creek Bay | 314 | Emaar (cluster) |
| Terra Woods | 251 | Emaar |
| The Meriva Collection | 230 | Ellington |
| Sobha Central | 228 | Sobha |
| Creek Haven | 163 | Emaar (cluster) |
| Serenz by Danube | 149 | Danube |
| Golf Vale | 125 | Emaar |
| The EDIT at d3 | 112 | Meraas |
| Maybach Six | 111 | Binghatti |
📝 Interpretation
A relatively small group of projects accounts for a meaningful share of April’s total transactions. These are largely developments in active sales phases, where pricing, positioning, and payment structures are aligned with current market demand.
What stands out is not just concentration, but diversity within that concentration.
- High-volume investor-driven projects (such as DAMAC Lagoons) anchor liquidity
- Masterplan-linked developments (Creek cluster) sustain steady absorption
- Mid-market and premium offerings (Sobha Central, design-led projects) maintain consistent traction
- Affordability-focused launches (Danube-led projects) continue to activate entry-level demand
This is a layered market, not a single narrative.
🧭 AIQYA Insight
Transaction concentration is a defining feature of Dubai’s market.
Demand does not disperse evenly.
It clusters around well-positioned supply.
Developers play an active role in shaping this clustering through:
- Launch timing
- Pricing bands
- Payment plan structures
April reinforces this dynamic. Even as sentiment was being tested, demand did not fragment across the market. It remained anchored within projects that were already structured to capture it.
Developer Activity – Market Layering
Across these projects, a clear developer ecosystem is visible:
- DAMAC leads in high-volume, investor-driven segments
- Emaar-linked clusters continue to anchor trust and sustained absorption
- Sobha maintains traction in quality-led mid-market positioning
- Danube activates the affordability band through structured payment plans
📝 Interpretation
Different developers operate in distinct layers of the market, and April does not disrupt this hierarchy. Instead, it highlights how each layer continues to function under varying conditions.
There is also a behavioural pattern worth noting.
Projects that continue to transact consistently share common traits:
- Clear pricing strategies
- Defined delivery timelines
- Structured payment plans
These reduce uncertainty for buyers, allowing transactions to continue even when external narratives introduce hesitation.
🧭 AIQYA Insight
April does not show a slowdown in developer activity.
It shows where demand chooses to stay.
When conditions become selective, buyers do not exit the market. They concentrate around:
- Trusted developers
- Structured offerings
- Clearly positioned projects
This concentration is not a sign of weakness. It is a sign of market efficiency.
Affordability Snapshot – Where Buyers Are Spending
If there is one section that defines April, it is this.
The distribution of transactions across price bands shows a market that is neither stretched at the top nor compressed at the bottom. Instead, it is anchored firmly within a broad but clearly defined affordability range.
Price Band Distribution – April 2026 (Apartments)
| Price Band | Share % | Market Role |
| AED 1.5M – 3M | 36.1% | Core upper-mid segment |
| AED 750K – 1.5M | 35.8% | Core entry-mid segment |
| < AED 750K | 14.4% | Entry-level liquidity |
| AED 3M+ | 13.7% | Premium / selective |
📝 Interpretation
Nearly 72% of all transactions fall within the AED 750K to 3M range, making this the market’s central operating band. Lower-ticket transactions remain active, while higher-value purchases continue but without expanding their share.
This distribution reframes a commonly held view.
The market is often described as being driven by sub-AED 1.5M affordability. April suggests a broader reality. The true centre of gravity lies across a wider mid-market band, extending up to AED 3M, where both investors and end-users actively participate.
🧭 AIQYA Insight
Dubai’s market is not defined by a single affordability point. It is defined by a liquidity range.
The AED 750K–3M band functions as the market’s circulation zone:
- Accessible to a wide buyer base
- Supported by rental demand
- Flexible in terms of exit
Within this range, capital can move efficiently across configurations and locations.
Ticket Behaviour – April Pattern
| Observation | Signal |
| Strong concentration in AED 750K–3M | Core liquidity band |
| Balanced split between lower-mid and upper-mid segments | Market stability |
| Limited expansion of AED 3M+ share | Selective premium demand |
📝 Interpretation
The market is not pushing aggressively into higher-ticket segments, nor is it retreating into lower ones. Instead, it is operating within its most efficient capital band, where transaction velocity and pricing stability are aligned.
There is also a direct relationship between affordability and earlier sections:
- The dominance of 1BR and 2BR configurations (≈71%)
- The concentration of unit sizes within 500–1500 sqft (≈68%)
Both map closely to this price range, reinforcing the idea that affordability is not just about income, but about how capital is structured within the market.
🧭 AIQYA Insight
Affordability in Dubai is not a constraint. It is a framework.
Buyers are not simply choosing what they can afford. They are choosing where:
- Liquidity is strongest
- Exit remains viable
- Rental demand provides support
April reflects a market that continues to operate within this framework, without stretching beyond it or retreating from it.
Buyer Profile & Demand Lens
Numbers explain what happened. Behaviour explains why.
April’s dataset points to a market that is still decisively investor-led, but not narrowly so. What emerges is a layered demand profile, where different buyer groups operate within clearly defined segments, each responding in its own way to the same set of conditions.
Demand Structure – April 2026
| Buyer Type | Dominant Segments | Behaviour Pattern |
| Investors | Studios, 1BR, select 2BR | High participation, liquidity-driven |
| End-users | 2BR, 3BR | Stable, needs-based decisions |
| Premium Buyers | 3BR+, large units | Selective, low-frequency |
📝 Interpretation
The dominance of one-bedroom units and the strength of the AED 750K–3M band point clearly to sustained investor participation. At the same time, the continued presence of mid-sized and larger homes suggests that end-user demand remains active, though less dominant in volume.
There is no visible withdrawal of any one segment. Instead, what April shows is relative intensity.
Investors continue to drive transaction volumes, particularly in the most liquid configurations. End-users remain present, but operate at a steadier pace, less influenced by short-term signals. Premium buyers, as expected, transact selectively, with decisions anchored in long-term considerations rather than market timing.
🧭 AIQYA Insight
Dubai’s residential market is not a single buyer story.
It functions through overlapping demand layers:
- Investors provide liquidity
- End-users provide stability
- Premium buyers provide depth
April does not disrupt this balance. It reinforces it.
Behaviour Under Observation – April Pattern
| Observation | Signal |
| Strong 1BR dominance (44.9%) | Investor-led activity |
| Stable 2BR share (26%) | End-user continuity |
| Limited 3BR+ participation (6.2%) | Selective premium demand |
| High off-plan share (82.5%) | Forward-looking commitments |
📝 Interpretation
The high share of off-plan transactions suggests that buyers are not acting defensively. They are committing to future delivery, indicating confidence in both pricing and market continuity.
Perception vs Data – The Sentiment Layer
Alongside the data, a different narrative circulated through April.
References to quieter luxury consumption, anecdotal signals from high-end districts, and informal indicators began to shape a perception of caution. These observations often travel quickly, particularly in markets that are closely watched.
However, they do not find a direct reflection in transaction data.
🧭 AIQYA Insight
Markets often speak in two languages:
- One of perception
- One of participation
April offers both.
Perception may shift quickly, influenced by visible cues and anecdotal signals. Participation, however, is harder to alter. It requires capital commitment, and that commitment remains clearly visible in the data.
There is also an important behavioural nuance.
If uncertainty were translating into risk aversion, it would show up as:
- Reduced off-plan participation
- Lower ticket sizes
- Increased reliance on ready properties
None of these are evident in April’s dataset.
📝 Interpretation
Buyers did not step back. They continued to participate within the same structural framework, with no meaningful shift toward defensive positioning.
🧭 AIQYA Insight
Confidence in Dubai’s market is not expressed through sentiment. It is expressed through commitment.
- Off-plan transactions reflect forward-looking confidence
- Stable price bands reflect disciplined capital allocation
- Consistent configuration choices reflect behavioural continuity
April does not indicate hesitation. It indicates continuity under observation.
Rental Trends & Yield Outlook (Freehold Residential)
Rental data provides a different lens on the market. While transactions reflect capital deployment, rents reflect income stability. In April, this relationship remains broadly aligned, though the dataset shows a narrower spread across configurations.
Rental Snapshot – April 2026
| Metric | Value |
| Median Annual Rent | AED 80,000 |
| Median Sales Ticket | AED 1.52M |
| Gross Yield (Median) | ~5.3% |
📝 Interpretation
At a median level, yields remain in the 5–5.5% range, consistent with a market where pricing and rental demand are broadly aligned. There is no sharp compression or expansion in yields at the aggregate level.
Rental Distribution – Dataset Signal
| Observation | Signal |
| Median rent concentrated around AED 80K | Mid-market rental dominance |
| Limited config differentiation in dataset | Reporting concentration |
| Strong alignment with 1BR-heavy sales market | Structural consistency |
📝 Interpretation
The dataset shows a concentration of rents around a mid-market band. This aligns with the transaction data, where 1BR and efficient 2BR units dominate, suggesting that rental demand is strongest in the same segments that drive sales.
Yield Context – Sales vs Rental Alignment
| Component | Observation |
| Sales Market | Dominated by AED 750K–3M |
| Rental Market | Anchored around mid-range rents (~AED 80K) |
| Yield Outcome | ~5.3% median |
📝 Interpretation
The yield outcome reflects a market where:
- Prices have moved up
- Rents have kept pace, but not expanded disproportionately
This results in stable, but not expanding yields.
🧭 AIQYA Insight
Dubai’s residential yield story is not about sudden spikes. It is about consistency within a structured band.
- Investor-heavy segments (1BR, compact 2BR) continue to anchor rental demand
- Pricing strength does not immediately translate into yield expansion
- Instead, yields stabilise within a range that balances capital growth and rental income
There is also a structural nuance worth noting.
Rental datasets, particularly in freehold segments, often under-represent:
- Studio-level leases
- Short-term and holiday home conversions
- Premium and ultra-luxury rentals
This means:
The observed yield is indicative, not exhaustive
🧭 AIQYA Insight
Yield in Dubai is not uniform across segments.
- Compact units typically outperform on yield
- Larger homes underperform on yield but compensate through capital appreciation
- Premium segments operate on a different investment logic altogether
April’s data, while aggregated, still reflects this layered structure.
Rental vs Buyer Behaviour – Alignment Check
| Segment | Sales Behaviour | Rental Signal |
| 1BR | Dominant (44.9%) | Strong rental base |
| 2BR | Stable (26%) | Balanced demand |
| 3BR+ | Limited (6.2%) | Lower yield relevance |
📝 Interpretation
There is a clear alignment between what buyers are purchasing and where rental demand is concentrated. This reinforces the idea that investor activity remains rational and yield-aware.
🧭 AIQYA Insight
April does not show a divergence between the sales and rental markets.
It shows alignment.
Buyers are continuing to participate in segments where:
- Rental demand is deep
- Occupancy risk is low
- Yield remains predictable
This alignment is one of the key stabilising forces in the market.
Configuration Spotlight – Project-Level Breakdown
Market-wide distributions tell us how buyers are behaving in aggregate. Project-level patterns reveal how that behaviour translates into actual transactions on the ground.
April’s leading projects show a consistent alignment with the broader market, but with distinct configuration biases depending on positioning.
Project-Level Behaviour – April 2026
| Project | Dominant Configuration | Price Band (Indicative) | Market Signal |
| DAMAC Lagoons – Valencia | 1BR / 2BR | Mid-market | High-volume investor activity |
| Creek Bay | 1BR / 2BR | Upper-mid | Masterplan-driven absorption |
| Terra Woods | 1BR | Entry to mid | Liquidity-focused demand |
| The Meriva Collection | 2BR | Mid to upper-mid | Balanced buyer mix |
| Sobha Central | 2BR | Upper-mid | Quality-led positioning |
| Serenz by Danube | Studio / 1BR | Entry to mid | Payment-plan driven |
| The EDIT at d3 | 1BR / 2BR | Premium mid | Design-led demand |
| Maybach Six | Larger formats | Premium | Selective transactions |
📝 Interpretation
Across the top-performing projects, one- and two-bedroom units dominate transaction volumes, mirroring the broader market. Projects positioned within the AED 750K–3M range show the highest absorption, while premium developments transact selectively with larger configurations.
What stands out is how closely project-level behaviour aligns with market structure.
- High-volume developments focus on 1BR and efficient 2BR units
- Masterplan and established clusters balance investor and end-user demand
- Affordable and payment-plan-led projects lean toward studios and compact units
- Premium projects maintain larger configurations but at lower transaction frequency
This is not coincidence. It reflects deliberate product positioning.
🧭 AIQYA Insight
Projects do not simply respond to demand. They are designed to fit into it.
Developers calibrate:
- Unit mix
- Size distribution
- Pricing bands
to align with where liquidity already exists in the market. April’s data shows that this alignment continues to hold, even when conditions are being tested.
Configuration vs Project Positioning
| Segment Type | Typical Configuration Mix | Behaviour |
| High-volume / Investor-driven | Studio + 1BR | Fast absorption |
| Mid-market balanced | 1BR + 2BR | Stable transactions |
| Premium / Lifestyle | 2BR + 3BR+ | Selective demand |
📝 Interpretation
There is a clear segmentation across projects. No single configuration dominates across all developments. Instead, each project attracts a specific buyer profile based on its pricing and positioning.
Another important observation is consistency.
Despite the heightened attention in April, there is no visible distortion in project-level behaviour:
- No sudden shift toward ultra-compact units
- No visible rush into premium configurations
- No disruption in configuration mix
🧭 AIQYA Insight
When markets are under stress, distortions appear at the edges.
April shows none.
Project-level behaviour remains aligned with:
- Price bands
- Buyer segments
- Established demand patterns
This consistency reinforces the broader conclusion that the market is adjusting within its structure, not outside it.
Configuration-level rental dispersion remains limited in the dataset.
Risks & Watchpoints
April’s data does not support a panic narrative. But that does not mean the market is without risk.
The stronger reading is more balanced: Dubai’s residential market remains liquid, price levels have held, and off-plan participation has strengthened. At the same time, the very structure that supports the market also creates areas that need monitoring.
Key Watchpoints – April 2026
| Watchpoint | Why It Matters |
| High off-plan dependence | Sustained momentum depends on launch absorption and buyer confidence |
| Price growth ahead of income fundamentals | Affordability pressure can build gradually |
| Concentration in select projects | Demand may be strong, but unevenly distributed |
| External sentiment shocks | Perception can shift faster than transaction data |
| Rental yield compression | If prices rise faster than rents, investor returns may tighten |
📝 Interpretation
The immediate data is strong, but the medium-term risk lies in overconcentration. With 82.5% of April transactions in off-plan, the market remains heavily tied to developer release cycles, payment plans, and future delivery confidence.
This does not suggest weakness. It suggests dependency.
Dubai’s off-plan system works because it offers structure: phased payments, clear product positioning, and a steady pipeline of launches. But if buyer sentiment weakens, or if delivery timelines begin to stretch, the same system can become more sensitive.
🧭 AIQYA Insight
The risk is not panic selling.
The risk is absorption fatigue.
As long as new supply continues to find buyers within the AED 750K–3M band, the market remains functional. But if launches accelerate faster than demand depth, pressure may first appear in slower absorption, softer payment-plan incentives, or longer resale timelines.
Sentiment vs Transaction Data
| Market Noise | Data Check |
| Panic selling rumours | Not supported by ready-market share |
| Price correction claims | Not visible in median price data |
| Luxury slowdown talk | Possible at the margins, but not market-wide |
| Buyer exit narrative | Not supported by transaction volume or off-plan share |
📝 Interpretation
Informal signals may capture mood, but they cannot replace transaction evidence. April shows continued capital commitment, not withdrawal.
The sharper watchpoint is rental yield.
With April’s median sales ticket at AED 1.52M and median annual rent at AED 80,000, the broad gross yield sits around 5.3%. This remains healthy, but not excessive. If prices continue rising faster than rents, yield-sensitive investors may become more selective.
🧭 AIQYA Insight
Dubai’s market strength is not only in price appreciation. It is in the balance between:
- Entry price
- Rental income
- Exit liquidity
- Developer trust
April keeps this balance intact. Future months will test whether it stretches.
What to Monitor Next
| Indicator | What It Will Reveal |
| May off-plan share | Whether April’s momentum continues |
| Ready-market share | Whether resale pressure appears |
| Median ticket size | Whether buyers stretch or retreat |
| Rental movement | Whether yields remain stable |
| Top project concentration | Whether demand broadens or narrows |
📝 Interpretation
The next signal will not come from headlines. It will come from whether April’s strength broadens into May, or remains concentrated around a small number of active projects.
🧭 AIQYA Insight
The market is not fragile, but it is not frictionless either.
April shows resilience. The watchpoint is whether this resilience remains broad-based, or becomes increasingly dependent on a few high-performing launches and developer ecosystems.
Supply Snapshot – What’s in the Pipeline
April’s demand patterns make more sense when viewed alongside how supply enters the market. In Dubai, supply is not passive. It is staged, timed, and actively structured through developer launches.
This makes the pipeline as important as the current transaction data.
Supply Characteristics – April Context
| Supply Layer | Behaviour |
| New Launches | Structured, phased release |
| Active Inventory | Concentrated within key projects |
| Legacy Stock | Stable, slower-moving |
| Future Pipeline | Aligned to mid-market demand |
📝 Interpretation
Supply is not flooding the market indiscriminately. It is being introduced in phases, with pricing and payment structures designed to align with the AED 750K–3M demand band that dominates transactions.
The dominance of off-plan activity at 82.5% reflects this pipeline structure. Buyers are not primarily engaging with existing inventory. They are participating in future supply, often at earlier stages of development.
This forward-looking demand has two implications.
First, it supports pricing discipline. Developers are able to control release volumes and pricing increments, reducing the likelihood of sudden price corrections. Second, it ties market momentum to absorption capacity. As long as new launches continue to be absorbed efficiently, the system remains stable.
🧭 AIQYA Insight
Dubai’s market is not supply-driven in the traditional sense. It is release-driven.
Inventory exists, but it only becomes relevant when it is brought to market under structured conditions. This allows developers to match supply with demand more precisely than in many other global markets.
Pipeline Alignment – Demand vs Supply
| Demand Signal | Supply Response |
| Strong 1BR dominance | Higher share of compact unit launches |
| 500–1500 sqft preference | Efficient unit sizing in new projects |
| AED 750K–3M concentration | Pricing calibrated within mid-market band |
| High off-plan participation | Continued launch-driven supply |
📝 Interpretation
There is a clear alignment between what buyers are purchasing and what developers are supplying. This reduces mismatch risk and supports steady absorption.
However, this alignment also introduces a watchpoint.
If supply begins to accelerate beyond demand depth, the first signs will not appear as price corrections. They will appear as:
- Slower absorption rates
- Increased reliance on extended payment plans
- Greater concentration of transactions within fewer projects
🧭 AIQYA Insight
The risk is not oversupply in absolute terms. It is misaligned supply timing.
Dubai’s system works as long as:
- Launch cycles remain calibrated
- Pricing remains within the core demand band
- Buyer participation continues across key segments
April suggests that this balance is intact.
The more important question is what happens next.
If demand continues to concentrate within the same projects and price bands, the pipeline will need to broaden to sustain momentum. If not, activity may remain strong, but increasingly clustered, rather than distributed.
🧭 AIQYA Insight
Supply in Dubai does not overwhelm the market.
It tests it.
And the outcome depends less on how much is built, and more on how and when it is released.
Observations & Buyer Takeaways
April does not mark a turning point. It clarifies how the market actually works.
The data shows a system that absorbed attention without losing structure. Transaction volumes remained in line with the quarterly run rate. Prices moved higher, not lower. Off-plan participation strengthened. Demand stayed concentrated within the same configuration, size, and price bands that have defined the market over the past year.
There is no evidence of panic behaviour in the transaction layer.
What appeared externally as uncertainty translated internally into pace adjustment, not directional change. The early-April surge settled into a stable rhythm, and the market continued to operate within its established framework.
What April Confirms
- The market’s core remains intact
→ 1BR and 2BR units (~71%) continue to anchor activity - Capital continues to operate within a defined band
→ AED 750K–3M accounts for ~72% of transactions - Pricing discipline holds
→ Median price rises from AED 1,755 to AED 1,865 psf - Off-plan remains the dominant channel
→ 82.5% of all transactions - Spatial demand remains balanced
→ 500–1500 sqft accounts for ~68% of transactions
📝 Interpretation
The consistency across these metrics suggests a market that is functioning as designed. There is no visible stress point where demand or pricing has broken away from structure.
What April Does Not Show
- No shift toward resale-driven activity
- No compression into ultra-low ticket segments
- No broad-based price correction
- No withdrawal of investor participation
🧭 AIQYA Insight
Markets often appear most uncertain when they are most observed.
April is a good example.
- External narratives pointed toward fragility
- Internal data shows continuity
This gap is where most misinterpretation happens.
Buyer Takeaways
For Investors
- The AED 750K–3M band remains the most liquid entry zone
- 1BR units continue to offer the strongest balance of yield and exit flexibility
- Yield levels (~5–5.5%) remain stable, not expanding
- Focus remains on project selection and developer credibility, not just price
For End-Users
- The 1000–1500 sqft segment (primarily 2BR) remains the most balanced option
- Larger homes are available, but transaction depth is thinner
- Pricing is holding, suggesting limited negotiation leverage in primary markets
For Premium Buyers
- Participation remains selective
- No clear signs of distress-driven opportunities
- Entry decisions remain tied to long-term positioning rather than short-term timing
Closing Note
Dubai’s residential market does not react in a single move.
It adjusts through layers:
- Activity shifts
- Participation concentrates
- Supply responds
April shows all three, but within a stable framework.
The more important takeaway is not what shifted, but what held.
Continue Your Research:
Dubai Villa Market April 2026: A Stable Segment
Data Source Attribution
This report is based on official transaction and rental records sourced from:
- Dubai Land Department (DLD) – Residential Freehold Transactions (April 2026)
- Dubai Land Department (DLD) – Rental Contracts (April 2026)
Scope & Filters Applied
To maintain consistency and comparability, the following filters were applied:
- Property Type: Residential Units (Flats only)
- Ownership: Freehold
- Exclusions:
- Villas, plots, commercial assets, offices, retail
- Mortgage records, gifts, grants, and non-sale transfers
- Sales Procedures Included:
- Sale
- Sell – Pre-registration
- Sale on Payment Plan
Separate datasets were extracted and analysed for:
- Villas
- Hotel Apartments
(Referenced contextually where relevant, but not included in core apartment metrics)
Data Processing Methodology
- Deduplication:
Transactions were deduplicated using a composite key of
Unit + Project Name + Registration Date + Area - Price Calculation:
Median price per square foot calculated as:
Transaction Value ÷ (Actual Area × 10.7639) - Configuration Mapping:
Standardised into:- Studio
- 1 Bedroom
- 2 Bedroom
- 3 Bedroom
- 3 Bedroom+ / Other
- Unit Size Conversion:
Areas originally recorded in square meters were converted to square feet for analysis. - Rental Yield:
Gross yield calculated as:
Median Annual Rent ÷ Median Sales Ticket
Notes on Data Interpretation
- Rental datasets may under-represent:
- Short-term leases
- Holiday homes
- Ultra-luxury rentals
- Mid-month datasets (April 1–15) are used for comparative trend analysis, not as standalone representations.
- Project and developer names have been standardised to address minor variations in spelling and formatting.
Disclaimer
Figures are based on officially registered datasets. Minor gaps may exist due to naming inconsistencies, reporting delays, or classification exclusions. This report is intended for insight and education purposes only and does not constitute financial advice.
You may also like:
Dubai Real Estate Market April 2026: Liquidity Narrows as Off-Plan Dominance Deepens
Dubai Real Estate Market March 2026 – A Measured Shift Toward Balance
Dubai Property Market Q1 2026: Structure, Pricing and Demand Trends
Dubai Housing Corridors: Where Growth Is Concentrating – Q1 2026 Analysis