Dubai Residential Market May 2026 recorded 7,859 apartment transactions worth AED 13.42 billion, with off-plan sales accounting for over 80% of activity. This data snapshot examines prices, buyer preferences, active projects, leading developers, and the areas driving market momentum.
| Metric | Value |
| Transactions | 7,859 |
| Sales Value | AED 13.42 Bn |
| Median Price | AED 1,665 psf |
| Off-Plan Share | 80.2% |
Residential Freehold Apartments | DLD Registered Transactions | May 1–30, 2026
Dubai’s residential apartment market remained strongly launch-led in May 2026, with off-plan transactions accounting for just over 80% of registered activity. Compact homes continued to drive liquidity, while premium and ultra-prime transactions kept the upper end of the market visible.
This snapshot is designed as a data-first monthly update.
Four out of every five apartment transactions in May originated in the off-plan market, reinforcing the influence of developer launch cycles on Dubai’s housing activity.
Executive Summary
| Metric | May 2026 |
| Total Transactions | 7,859 |
| Total Transaction Value | AED 13.42 Bn |
| Average Ticket Size | AED 1.71 Mn |
| Median Ticket Size | AED 1.10 Mn |
| Average Price | AED 1,824 psf |
| Median Price | AED 1,665 psf |
| Median Unit Size | 731 sq ft |
| Off-Plan Share | 80.2% |
| Ready Share | 19.8% |
| Highest Apartment Sale | AED 112.6 Mn |
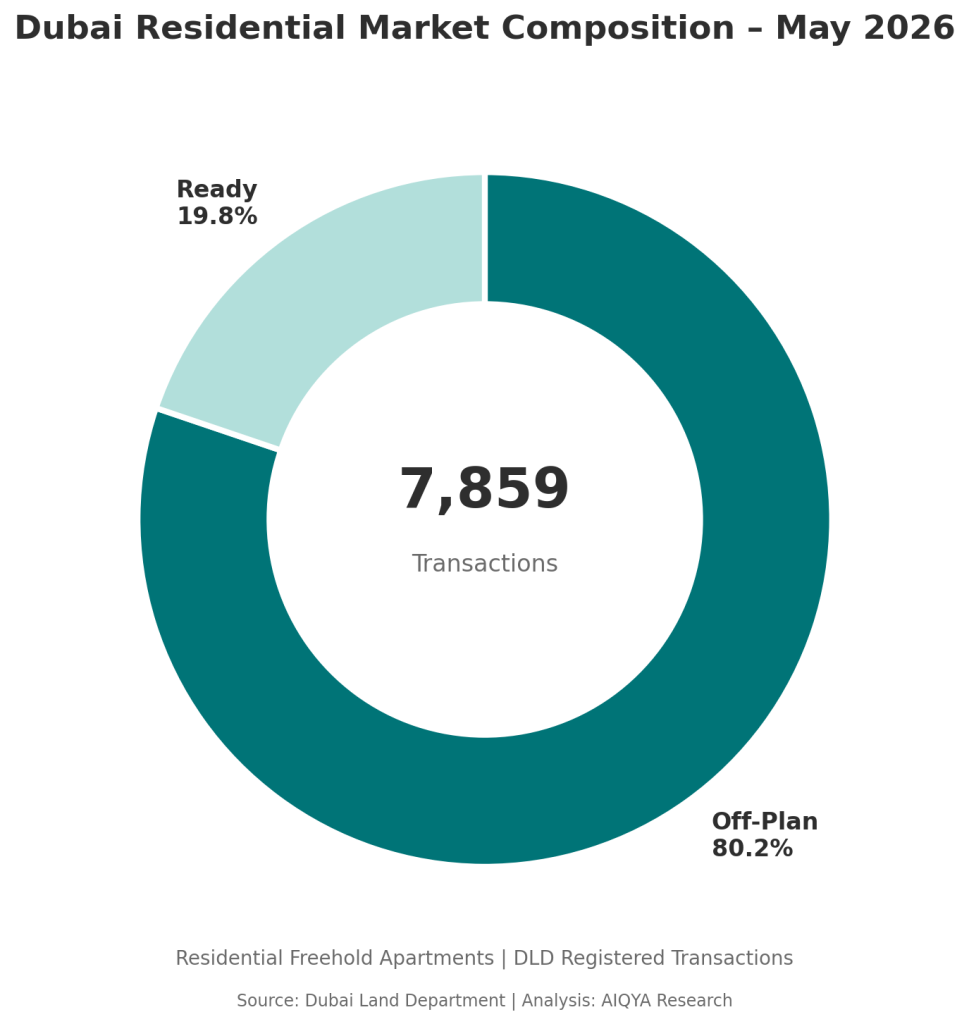
Dubai Residential Market Composition – May 2026
Off-Plan vs Ready Market
| Segment | Transactions | Share | Median Price |
| Off-Plan | 6,303 | 80.2% | AED 1,706 psf |
| Ready | 1,556 | 19.8% | AED 1,317 psf |
The May market remained firmly primary-market led. More than four out of every five apartment transactions were off-plan, reinforcing how developer launches continue to shape Dubai’s residential transaction cycle.
Studios and one-bedroom apartments accounted for more than three-quarters of all transactions, highlighting the continued importance of compact homes as the market’s liquidity engine.”
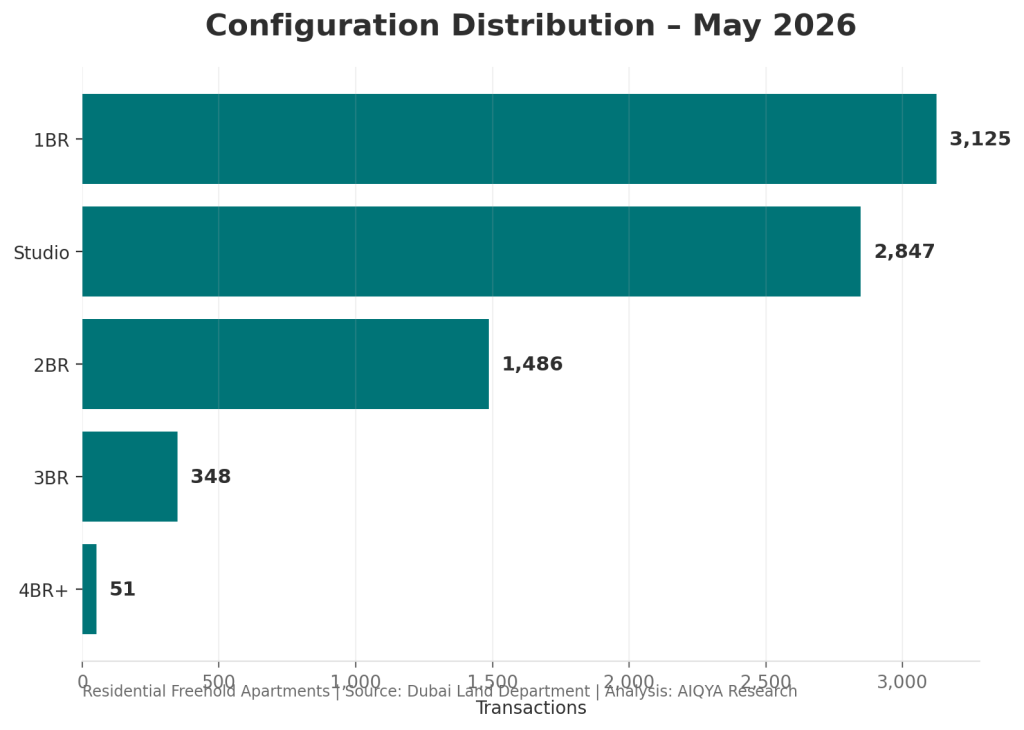
Configuration Distribution – May 2026
Configuration Distribution
| Configuration | Transactions | Share | Median Ticket | Median Price |
| Studio | 2,847 | 36.2% | AED 630,000 | AED 1,675 psf |
| 1BR | 3,125 | 39.8% | AED 1.22 Mn | AED 1,618 psf |
| 2BR | 1,486 | 18.9% | AED 2.11 Mn | AED 1,728 psf |
| 3BR | 348 | 4.4% | AED 4.16 Mn | AED 2,178 psf |
| 4BR+ | 51 | 0.6% | AED 12.21 Mn | AED 2,835 psf |
Studios and one-bedroom apartments together accounted for 76% of May transactions, confirming that compact homes remain the liquidity engine of Dubai’s apartment market.
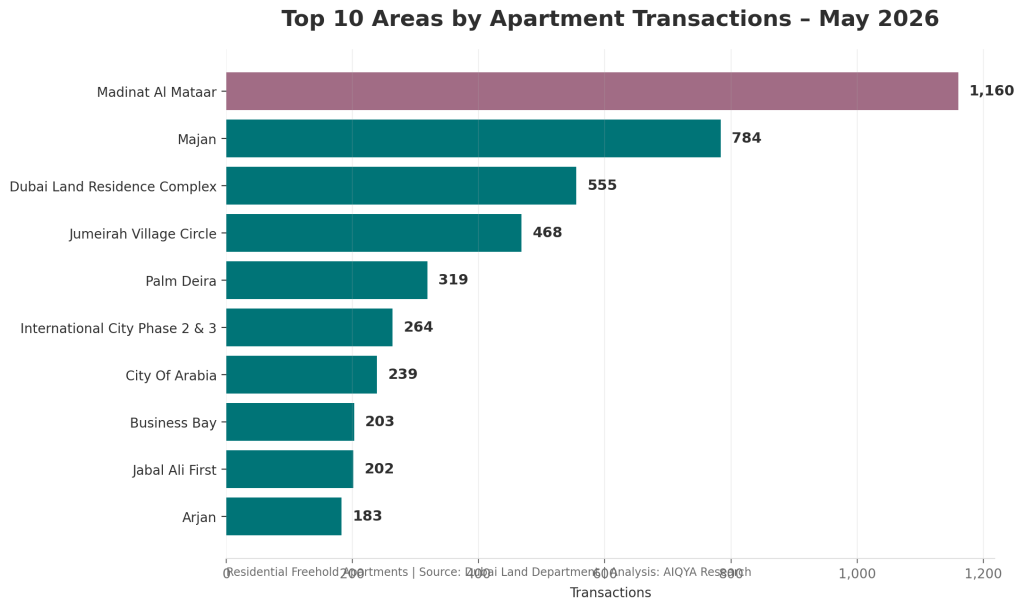
Top 10 Areas by Apartment Transactions – May 2026
Most Active Areas
| Area | Transactions | Share | Median Ticket | Median Price |
| Madinat Al Mataar | 1,160 | 14.8% | AED 735,920 | AED 1,703 psf |
| Majan | 784 | 10.0% | AED 585,000 | AED 1,384 psf |
| Dubai Land Residence Complex | 555 | 7.1% | AED 793,776 | AED 1,480 psf |
| Jumeirah Village Circle | 468 | 6.0% | AED 990,000 | AED 1,455 psf |
| Palm Deira | 319 | 4.1% | AED 3.26 Mn | AED 3,062 psf |
| International City Phase 2 & 3 | 264 | 3.4% | AED 564,536 | AED 1,018 psf |
| City of Arabia | 239 | 3.0% | AED 595,000 | AED 1,662 psf |
| Business Bay | 203 | 2.6% | AED 1.86 Mn | AED 2,229 psf |
| Jabal Ali First | 202 | 2.6% | AED 1.95 Mn | AED 1,697 psf |
| Arjan | 183 | 2.3% | AED 986,888 | AED 1,635 psf |
Madinat Al Mataar, Majan, DLRC and JVC formed the core volume corridors, while Palm Deira and Business Bay reflected higher-value urban and waterfront activity.
Most Active Projects
| Project | Transactions | Median Ticket | Median Price |
| AZIZI VENICE 14 | 504 | AED 655,000 | AED 1,716 psf |
| Binghatti Skyflame 1 | 442 | AED 550,000 | AED 1,350 psf |
| Binghatti Skyflame 2 | 193 | AED 565,000 | AED 1,387 psf |
| THE MERIVA COLLECTION | 122 | AED 4.71 Mn | AED 3,475 psf |
| Azizi Milan Heights | 109 | AED 611,000 | AED 1,739 psf |
| DAMAC Lagoons – Valencia | 95 | AED 777,000 | AED 1,846 psf |
| Sobha Central | 80 | AED 2.08 Mn | AED 3,235 psf |
| Linea by Holm | 76 | AED 1.55 Mn | AED 2,524 psf |
| Greenfield by Samana Developers | 75 | AED 899,062 | AED 1,404 psf |
| Le Blanc Residence by Imtiaz | 68 | AED 816,982 | AED 1,657 psf |
The project table shows the breadth of May’s market: affordable high-volume launches on one side and premium branded or lifestyle-led developments on the other.
Developer Brand Presence
Developer names are estimated from project naming patterns where a separate statutory developer field was not available.
| Developer / Brand | Transactions | Share | Median Ticket |
| Azizi | 1,534 | 19.5% | AED 676,000 |
| Binghatti | 786 | 10.0% | AED 585,000 |
| DAMAC | 279 | 3.6% | AED 1.15 Mn |
| Imtiaz | 242 | 3.1% | AED 1.27 Mn |
| Samana | 172 | 2.2% | AED 925,389 |
| Emaar | 158 | 2.0% | AED 2.13 Mn |
| Sobha | 139 | 1.8% | AED 2.03 Mn |
| Danube | 137 | 1.7% | AED 1.21 Mn |
| Ellington | 71 | 0.9% | AED 2.96 Mn |
Azizi and Binghatti dominated identified volume activity in May, largely through compact, investor-friendly apartment stock.
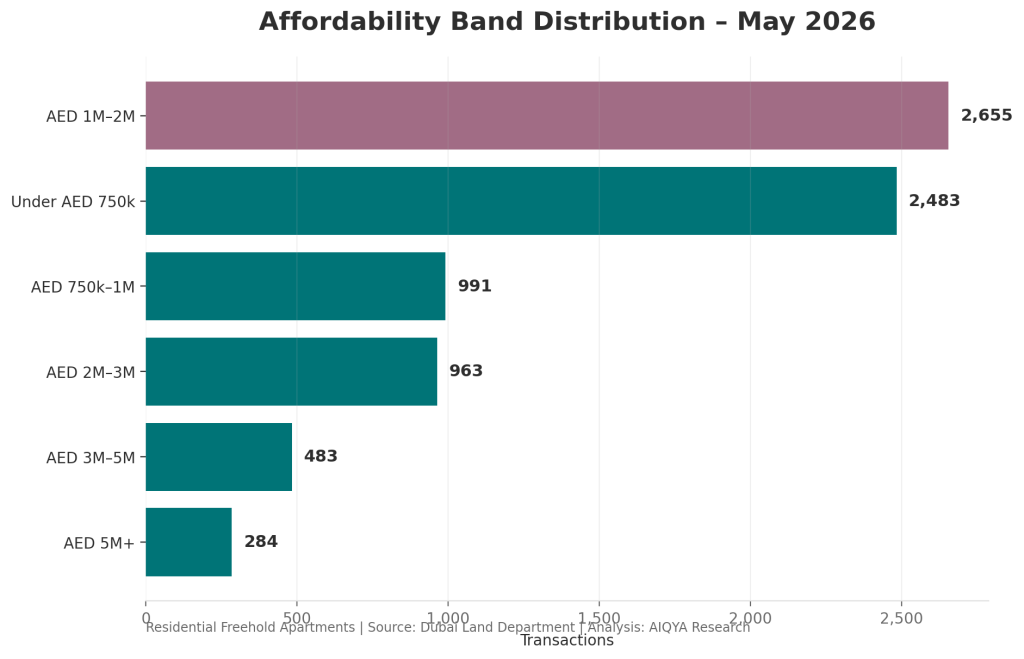
Affordability Band Distribution – May 2026
Affordability Distribution
| Ticket Size Band | Transactions | Share | Median Price |
| Under AED 750k | 2,483 | 31.6% | AED 1,542 psf |
| AED 750k–1M | 991 | 12.6% | AED 1,462 psf |
| AED 1M–2M | 2,655 | 33.8% | AED 1,587 psf |
| AED 2M–3M | 963 | 12.3% | AED 2,317 psf |
| AED 3M–5M | 483 | 6.1% | AED 2,737 psf |
| AED 5M+ | 284 | 3.6% | AED 3,564 psf |
The AED 1M–2M band was the largest single affordability bracket, followed closely by homes below AED 750k. Together, these two bands accounted for nearly two-thirds of May’s apartment transactions.
Unit Size Distribution
| Unit Size Band | Transactions | Share | Median Ticket |
| Under 400 sq ft | 1,362 | 17.3% | AED 635,535 |
| 400–600 sq ft | 1,606 | 20.4% | AED 647,866 |
| 600–900 sq ft | 2,651 | 33.7% | AED 1.22 Mn |
| 900–1,200 sq ft | 883 | 11.2% | AED 1.67 Mn |
| 1,200–1,600 sq ft | 829 | 10.5% | AED 2.45 Mn |
| 1,600–2,500 sq ft | 422 | 5.4% | AED 3.88 Mn |
| 2,500+ sq ft | 106 | 1.3% | AED 10.05 Mn |
The market’s centre of gravity remained between 400 and 900 sq ft, matching the dominance of studios and one-bedroom apartments.
Highest Apartment Sales
| Rank | Project | Area | Configuration | Sale Value |
| 1 | Solaya (5,7) | Jumeirah First | 5BR | AED 112.6 Mn |
| 2 | Solaya (4,6) | La Mer | 5BR | AED 106.0 Mn |
| 3 | CASA AHS | Dubai Water Canal | 6BR | AED 101.2 Mn |
| 4 | ORLA by Omniyat | Palm Jumeirah | 4BR | AED 57.9 Mn |
| 5 | Como Residences | Palm Jumeirah | 4BR | AED 56.5 Mn |
Ultra-prime transactions remained visible at the top end of the market, led by Jumeirah First, La Mer, Dubai Water Canal and Palm Jumeirah.
AIQYA Takeaway
May 2026 was not a quiet market. It was a market shaped by two speeds.
The first was the volume market: studios, one-bedroom apartments, off-plan launches and sub-AED 2 million homes. This remained the liquidity engine.
The second was the premium market: larger homes, waterfront addresses and ultra-prime branded residences. This segment did not drive volume, but it continued to anchor Dubai’s luxury narrative.
The immediate reading is clear: Dubai’s apartment market remains strongly developer-led, compact-home heavy, and highly dependent on launch cycles. May’s data shows that both affordability-driven demand and ultra-prime transactions continue to coexist within the same market.
Data Source & Method Note
Source: Dubai Land Department registered transaction dataset.
Scope: Residential, Freehold, Unit, Flats only.
Period: May 1–30, 2026.
Included procedures: Sale, Sell – Pre Registration, Sale on Payment Plan.
Excluded: mortgages, grants, delayed sales, lease-to-own, commercial assets, offices, shops, hotel apartments, villas, and plots.
Price metric: AED per sq ft calculated as transaction value divided by actual area converted from sq m to sq ft using 10.7639.
Developer/brand activity: estimated from project naming patterns where no separate statutory developer field was available.
Figures are based on official registered datasets. Minor gaps may exist due to naming inconsistencies or exclusions. The report is intended for insight and education, not financial advice.
More Read: