Dubai property market Q1 2026 reflects a system that is active but contained within a defined structure. With 33,943 apartment transactions, stable pricing around AED 1,754 per sq.ft, and strong off-plan dominance, the quarter reveals where demand is concentrated and how the market sustains its momentum without stretching beyond its core affordability band.
- Q1 2026 – Market Overview
- Key Market Metrics – Q1 2026
- Price Trends & Market Interpretation – Q1 2026
- Primary vs Secondary Market Composition – Q1 2026
- Configuration Distribution – What Buyers Are Choosing (Q1 2026)
- Unit Size Trends & Market Signals – Q1 2026
- Top Projects & Developer Activity – Q1 2026
- Affordability Snapshot – Where Buyers Are Spending
- Buyer Profile & Demand Lens – Q1 2026
- Rental Trends & Yield Outlook – Q1 2026
- Configuration Spotlight – Project-Level Breakdown
- Risks & Watchpoints – Q1 2026
- Supply Snapshot – What’s in the Pipeline
- Final Observations & Buyer Takeaways
- Data Source Attribution
All quarterly references follow the calendar year (Jan–Dec).
This is a market defined by structure, not surge.
Q1 2026 – Market Overview
Dubai’s apartment market in Q1 2026 does not open with a surprise. It continues a pattern that has been building over the last few quarters — active, structured, and increasingly defined by where demand is comfortable operating.
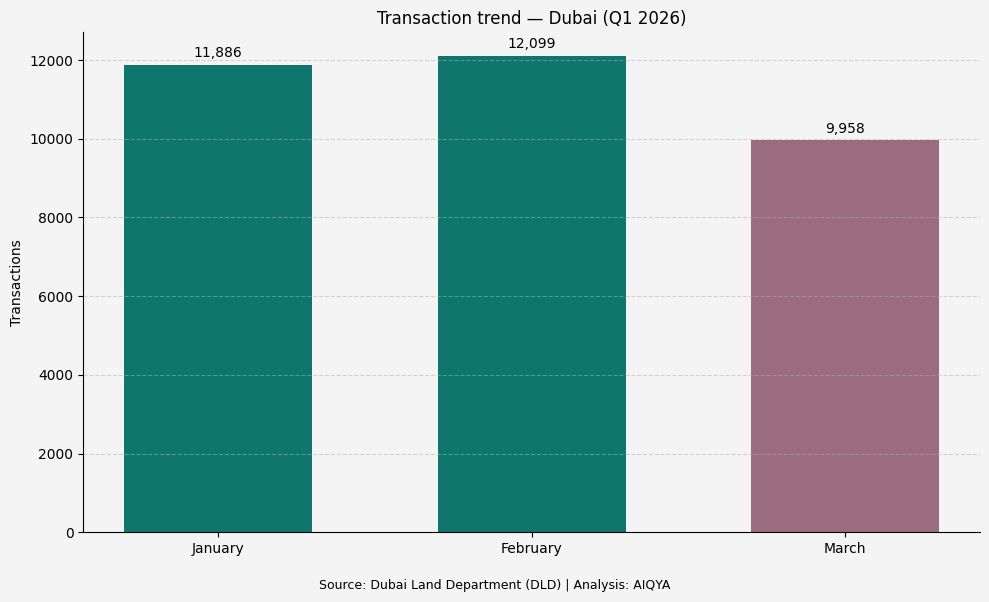
The quarter records 33,943 transactions, holding momentum through the first two months before easing into March. The progression is visible, but not dramatic.
| Month | Transactions |
| January | 11,886 |
| February | 12,099 |
| March | 9,958 |
February edges ahead as the strongest month, while March softens. The drop is noticeable at roughly 17–18% from the peak, but it does not carry the characteristics of a demand break. It reads more like a pause within an active cycle, where absorption catches up before the next phase of activity.
Pricing sits in a similarly controlled range. The median settles at AED 1,754.87 per sq.ft, with a typical transaction at AED 1.389 million. This is not a market stretching upward, nor one adjusting downward. It is operating within a band it has already established.
That band matters. It places the bulk of activity within the AED 1M–2M range — a segment that continues to carry the weight of the market. It is accessible enough for investor participation, yet stable enough to support end-user entry.
The structure beneath these numbers is equally important. The market remains decisively off-plan led, with 75.64% of transactions tied to projects under construction. This is not just a supply story. It is a behavioural one. Buyers are choosing timelines, payment structures, and future positioning as much as they are choosing location or layout.
At the same time, the composition of transactions points to where liquidity actually sits. Studios and 1BR units together account for nearly two-thirds of all activity. These are not simply smaller homes. They are the market’s most functional units — easier to enter, easier to rent, and easier to exit.
The rental layer reinforces this structure. With 149,423 leasing contracts recorded in the same period and a median annual rent of AED 64,000, the market continues to operate as a lived system, not just a transactional one. The implied yield of roughly 4.6% does not signal excess return, but it does provide enough alignment between price and income to sustain participation.
What emerges from Q1 is not acceleration, but clarity.
Volume is present, but not stretched.
Pricing is stable, but not stagnant.
Demand is concentrated, but not narrow.
The market is not searching for direction.
It is functioning within one.
Key Market Metrics – Q1 2026
If the opening sets the tone, the numbers here define the boundaries within which the market is operating. Q1 does not show extremes. It shows a system that is active, but contained within a clearly defined range.
At a headline level, 33,943 apartment transactions establish the scale of activity. That is a meaningful volume for a single quarter, but what matters more is how evenly it is distributed and where it concentrates.
Pricing sits within a narrow band. The median at AED 1,754.87 per sq.ft and a median ticket of AED 1.389 million together point to a market that is not stretching upward in search of growth. Instead, it is reinforcing a familiar affordability zone.
| Metric | Q1 2026 |
| Transactions | 33,943 |
| Median AED/psf | 1,754.87 |
| Median ticket (AED) | 1,389,000 |
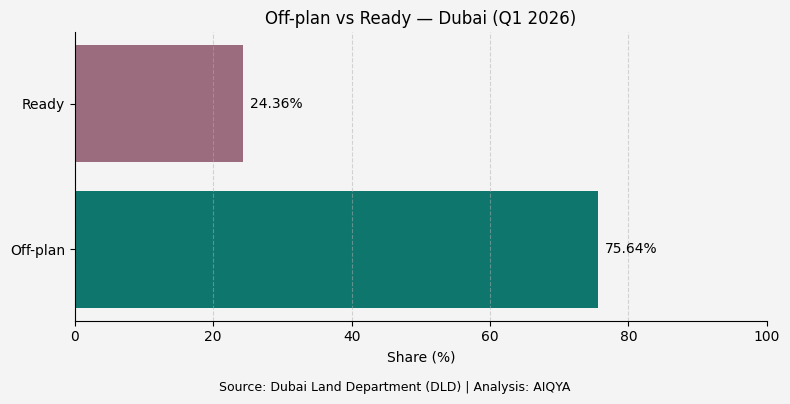
The structure of transactions adds another layer to this. The market remains firmly tilted toward new supply, with 75.64% of activity in off-plan projects.
| Segment | Share |
| Off-plan | 75.64% |
| Ready | 24.36% |
This imbalance is not a temporary spike. It reflects a system where the mechanics of buying — payment plans, construction timelines, and developer positioning — continue to shape demand more strongly than immediate availability.
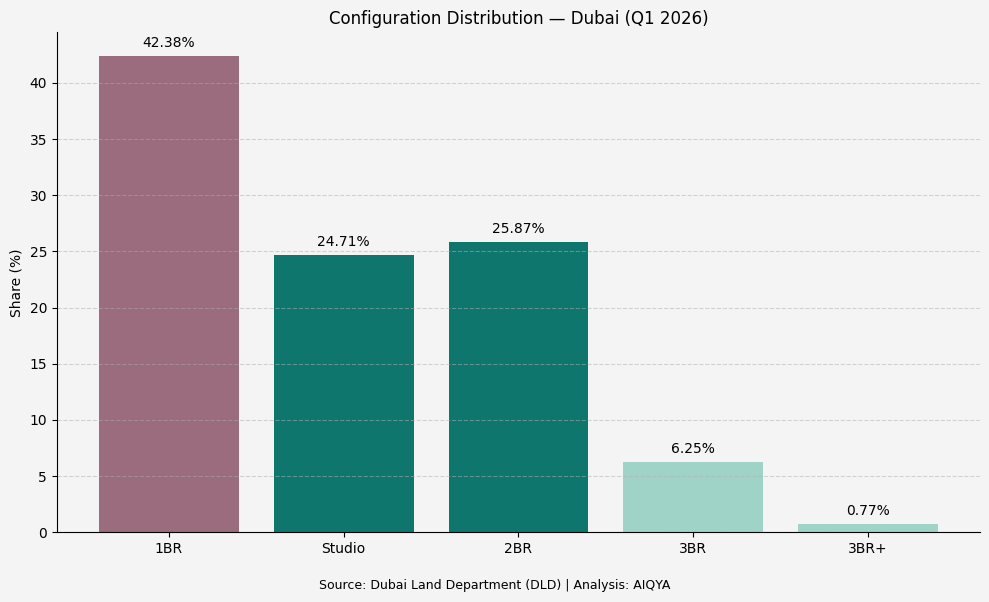
The configuration mix reveals where the bulk of that demand sits. 1BR units alone account for over 42% of transactions, with studios adding another 24.71%. Together, they form the core of the market’s liquidity.
| Configuration | Share |
| 1BR | 42.38% |
| Studio | 24.71% |
| 2BR | 25.87% |
| 3BR | 6.25% |
| 3BR+ | 0.77% |
What this means in practical terms is that the market is not being driven by larger homes or premium segments. It is being sustained by formats that can move consistently, even when overall momentum shifts.
The rental layer completes the picture. With 149,423 leasing contracts, activity here is not just higher than sales — it is significantly deeper. The median annual rent of AED 64,000 translates into an implied yield of roughly 4.6%, anchoring the market in income as much as in capital movement.
| Metric | Rental Q1 |
| Contracts | 149,423 |
| Median rent (AED) | 64,000 |
| Implied yield | ~4.6% |
The interplay between these numbers is what defines Q1. Pricing remains stable because demand is concentrated in accessible segments. Off-plan continues to dominate because the structure of buying supports it. Rental activity remains high enough to ensure that the system is not purely transactional.
Individually, these metrics are straightforward. Together, they describe a market that is functioning with a degree of balance that is easy to miss if viewed only through headlines.
Price Trends & Market Interpretation – Q1 2026
If the quarter’s volumes show a controlled easing into March, pricing tells a quieter story. It does not follow volume downward. It holds.
That divergence is the first signal worth noting.
A simple monthly view frames the movement:
| Month | Transactions | Median AED/psf | Median Ticket (AED) |
| January | 11,886 | 1,768.93 | 1,381,800 |
| February | 12,099 | 1,743.29 | 1,392,000 |
| March | 9,958 | 1,752.99 | 1,390,000 |
A simple monthly view frames the movement:
Pricing softens slightly in February before firming again in March, even as transaction volumes decline.
The pattern is consistent with what we observed in the overview. February carries the peak in activity, but pricing does not rise alongside it. Instead, it moderates slightly before stabilising again in March.
This matters because markets typically signal stress through price before volume. Here, the opposite happens. Volume softens, price holds within a narrow band. That suggests the system is not under pressure to clear inventory.
The off-plan and ready split adds more clarity to this behaviour.
Off-plan pricing continues to sit above the market median, supported by newer inventory and forward positioning. As the share of off-plan transactions remains high, it exerts an upward pull on overall median pricing. This is not a broad-based repricing of the city. It is a composition effect — more transactions occurring in a segment that is inherently priced higher.
The ready market behaves differently. Pricing here remains relatively stable through the quarter, moving within a tighter range. This reflects the nature of resale transactions, where pricing is influenced more by building age, layout, and immediate livability than by launch positioning.
Together, these two segments form parallel pricing lanes. One is forward-looking, shaped by expectations and product narratives. The other is grounded in present conditions, where price discovery is slower and more unit-specific.
Ticket sizes reinforce this stability. The median transaction remains anchored around AED 1.389 million, with no visible expansion toward higher bands. This indicates that while pricing per square foot may adjust slightly, the market is still calibrating itself to what buyers can realistically absorb.
There is also a structural layer beneath this. The dominance of compact configurations plays a role in keeping pricing contained. Studios and 1BR units, which make up the majority of transactions, operate within tighter price bands. Their weight in the dataset prevents large swings in median pricing.
What Q1 ultimately shows is a market where pricing is not leading the story. It is following structure.
Volume can move. Launch cycles can shift.
But as long as:
- off-plan continues to dominate
- compact units continue to carry liquidity
- and ticket sizes remain anchored
pricing is likely to remain within a controlled range.
That is what defines the quarter. Not growth, not correction — but pricing discipline within an active market.
Primary vs Secondary Market Composition – Q1 2026
If pricing in Q1 is stable, the reason sits here.
The market remains decisively tilted toward new supply, with off-plan transactions accounting for 75.64% of activity, leaving the ready segment at 24.36%.
| Segment | Share |
| Off-plan | 75.64% |
| Ready | 24.36% |
This is not a marginal lead. It is structural dominance. Nearly three out of every four transactions are tied to projects under construction, which means the market’s momentum is being shaped by what is being launched, not just what already exists.
What stands out is the consistency of this behaviour. Even as transaction volumes ease into March, the market does not rotate toward ready inventory. Off-plan continues to absorb demand at the same scale. That continuity matters, because it suggests that buyers are not reacting defensively. They are still willing to commit to delivery timelines.
The difference between these two segments is less about price and more about how buyers engage with them.
Off-plan transactions are built around structured entry. Payment plans reduce upfront commitment, allowing buyers to step into the market without deploying full capital immediately. This makes off-plan particularly attractive in a market where pricing remains stable but ticket sizes are still meaningful.
The ready market operates differently. It requires immediate capital, but offers certainty. It is tied to existing buildings, current rental potential, and known quality. Pricing here is less influenced by launch narratives and more by unit-specific factors.
These two lanes coexist, but they do not behave the same way.
- Off-plan is forward-looking, influenced by expectation and product positioning
- Ready is present-focused, driven by usability and realised value
This distinction is what keeps pricing stable even when volumes shift. As long as the bulk of transactions remain in off-plan, overall pricing will reflect the positioning of new supply rather than the slower-moving dynamics of the resale market.
At the same time, the ready segment plays an important balancing role. It anchors the market in current conditions, providing a reference point that is less influenced by developer pricing strategies.
Q1 does not show a market shifting between these two lanes. It shows one lane clearly leading, while the other remains steady.
That imbalance is not a weakness. It is how Dubai’s apartment market is currently structured.
Configuration Distribution – What Buyers Are Choosing (Q1 2026)
If the previous section explains where transactions are happening, this one explains what is actually moving.
The distribution is not evenly spread. It is concentrated, and that concentration is consistent.
| Configuration | Share |
| 1BR | 42.38% |
| Studio | 24.71% |
| 2BR | 25.87% |
| 3BR | 6.25% |
| 3BR+ | 0.77% |
Nearly 67% of all transactions sit within studios and 1BR units, with another ~26% in 2BRs. Larger homes remain a thin layer by comparison.
This is not a one-quarter anomaly. It is a pattern that defines how the market sustains its volume.
Studios and 1BRs function as the market’s liquidity base. They require lower entry capital, align more easily with rental demand, and offer clearer resale pathways. In a system where off-plan dominates, these formats also fit naturally within developer pricing strategies and payment structures.
What is important is not just their share, but their role. When nearly two-thirds of transactions are concentrated in compact units, the market’s behaviour becomes more predictable. Pricing remains contained, absorption remains steady, and demand does not stretch into segments that require higher commitment.
The 2BR segment sits in between. At 25.87%, it is not a fringe category, but it behaves differently. It carries a mix of investor and end-user intent, often acting as a transition point between compact investment-led purchases and larger, lifestyle-driven decisions.
Beyond this, the market thins quickly. 3BR and larger configurations together account for just over 7% of transactions. These homes do not operate on the same dynamics. Their demand is more selective, influenced by location, layout, and specific project positioning rather than broad market momentum.
This distribution also explains why pricing remains stable. When the bulk of activity is concentrated in smaller, more standardised units, large swings become less likely. The market is anchored by segments that move consistently.
Q1 does not show a shift toward larger homes. It shows a continued consolidation around formats that are easier to transact.
That is where the volume sits. And that is where the market continues to find its balance.
Unit Size Trends & Market Signals – Q1 2026
Configuration tells us what is being bought. Unit size tells us how that product is being shaped, and in Q1, the signal is less about expansion and more about consistency.
Most transactions continue to sit within a tight size band, reinforcing the idea that the market is operating within a familiar and repeatable envelope rather than stretching into larger formats.
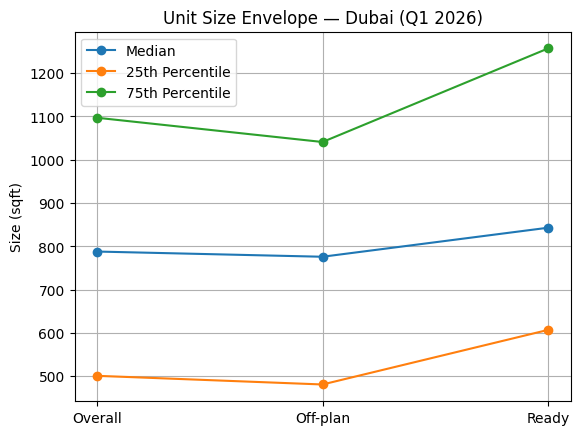
Size envelope (all apartments, Q1 2026)
| Segment | Median size | 25th percentile | 75th percentile | 10th percentile | 90th percentile |
| Overall | 73.23 sqm (788 sqft) | 46.55 sqm (501 sqft) | 101.94 sqm (1,097 sqft) | 37.06 sqm (399 sqft) | 138.48 sqm (1,491 sqft) |
| Off-plan | 72.12 sqm (776 sqft) | 44.65 sqm (481 sqft) | 96.74 sqm (1,041 sqft) | 36.56 sqm (394 sqft) | 133.50 sqm (1,437 sqft) |
| Ready | 78.35 sqm (843 sqft) | 56.39 sqm (607 sqft) | 116.82 sqm (1,257 sqft) | 39.14 sqm (421 sqft) | 160.42 sqm (1,727 sqft) |
The contrast between off-plan and ready inventory is subtle, but important. Off-plan units cluster within a tighter range, reflecting standardised layouts and pricing discipline. Ready homes show a wider spread, particularly toward the upper end, where larger units and older building formats expand the size envelope.
This difference becomes more explicit when we look at how unit sizes behave within each configuration.
Median unit sizes by configuration (Q1 2026)
| Configuration | Overall median size | Off-plan median size | Ready median size |
| Studio | 38.54 sqm (415 sqft) | 38.16 sqm (411 sqft) | 41.11 sqm (442 sqft) |
| 1BR | 72.78 sqm (783 sqft) | 72.40 sqm (779 sqft) | 74.31 sqm (800 sqft) |
| 2BR | 116.22 sqm (1,251 sqft) | 115.33 sqm (1,241 sqft) | 122.47 sqm (1,319 sqft) |
| 3BR | 177.81 sqm (1,914 sqft) | 173.47 sqm (1,867 sqft) | 188.47 sqm (2,029 sqft) |
Across every configuration, ready units are consistently larger. The difference is modest in studios and 1BRs, but becomes more pronounced as we move into 2BR and 3BR formats. This reflects the nature of older inventory, where layouts tend to be more generous, even if pricing per square foot is lower.
Off-plan, by contrast, shows a tighter sizing discipline. The variation is minimal, particularly in the segments that carry the most volume. This is not accidental. It reflects a deliberate effort to keep units aligned with pricing bands that buyers can absorb.
Together, these two views explain how the market maintains both liquidity and variation at the same time. Off-plan creates consistency and comparability. Ready stock introduces diversity and space.
What remains unchanged is the centre.
The median unit continues to sit just under 75 sqm, and the majority of transactions cluster within a narrow range around it. There is no visible shift toward larger homes at scale.
Instead, the market is refining what already works.
It is not getting bigger.
It is getting more precise.
Top Projects & Developer Activity – Q1 2026
Q1’s transaction volume is not concentrated in a single project or a single launch cycle. It is distributed across a wide set of developments, which suggests that absorption is broad rather than dependent on a few headline projects.
In the off-plan segment, where most activity sits, the leading projects contribute meaningfully but do not dominate the quarter.
Top off-plan projects by transaction volume (Q1 2026)
| Project | Transactions | Share of Off-plan |
| MAYBACH SIX | 656 | 2.56% |
| BINGHATTI VINTAGE | 539 | 2.10% |
| HADO BY BEYOND | 514 | 2.00% |
| SIERRA BY IMAN | 338 | 1.32% |
| BINGHATTI CULLINAN | 323 | 1.26% |
| WINDSOR HOUSE | 280 | 1.09% |
| SAMANA BOULEVARD HEIGHTS | 276 | 1.07% |
| SKYVUE | 271 | 1.06% |
| WINDSOR HOUSE II | 243 | 0.95% |
| BREEZ BY DANUBE | 239 | 0.93% |
No single project crosses even 3% of off-plan volume. That is the key signal.
The market is not being carried by one launch. It is being sustained by continuous supply across multiple developers, each contributing incrementally. This is consistent with what we observed earlier — a system driven by cadence rather than concentration.
Another layer becomes visible when we look at developer repetition. Names like Binghatti, Samana, and others appear multiple times across the list, not through one project, but through a pipeline of launches. This reinforces the idea that volume in Dubai is often built through frequency, not scale alone.
The ready market behaves differently, and the dataset reflects that.
Ready market — project tagging reality (Q1 2026)
| Category | Transactions | Share of Ready |
| Project not tagged / unclear | 2,207 | 26.7% |
| Top tagged project (Paradise View 1) | 134 | 1.6% |
| Next tier projects (selected) | 40–100 range | <1.2% each |
A significant share of ready transactions sits under “NAN” or unclean project mapping, accounting for over a quarter of the segment. This is a data limitation rather than a market reality, but it changes how the segment must be read.
Unlike off-plan, where project-level ranking is clean and meaningful, the ready market is fragmented and less visible at the project level. Transactions are real and steady, but they are spread across buildings where attribution is inconsistent.
This creates a clear contrast:
- Off-plan → structured, launch-led, cleanly mapped
- Ready → dispersed, lived-in, harder to aggregate
What Q1 ultimately shows is a market where supply is broadly distributed and actively absorbed.
There is no single project driving the quarter.
There is no dependence on one developer cycle.
Instead, volume builds across a wide base of projects, supported by developers who are consistently delivering product that fits the market’s liquidity layer.
That breadth is what supports stability.
Affordability Snapshot – Where Buyers Are Spending
If volume tells us how active the market is, affordability tells us where that activity is comfortable.
Q1 does not scatter across the spectrum. It clusters.
The bulk of transactions sit within a defined mid-market band, where entry feels manageable and resale remains viable. The data shows a clear centre of gravity around the AED 1M–2M range, with activity tapering off toward both ends.
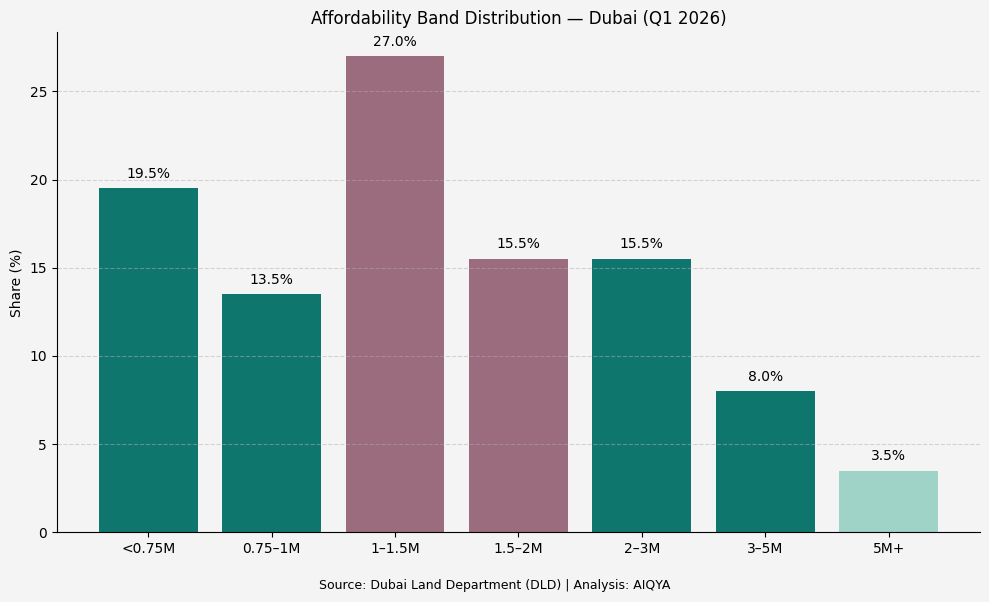
Ticket distribution (Q1 2026)
| Ticket Band (AED) | Transactions | Share | Dominant Configuration |
| < 0.75M | ~6,500–7,000 | ~19–20% | Studio |
| 0.75M – 1.0M | ~4,500–5,000 | ~13–14% | Studio |
| 1.0M – 1.5M | ~9,000–9,500 | ~26–28% | 1BR |
| 1.5M – 2.0M | ~5,000–5,500 | ~15–16% | 1BR |
| 2.0M – 3.0M | ~5,000–5,500 | ~15–16% | 2BR |
| 3.0M – 5.0M | ~2,500–3,000 | ~7–9% | 2BR |
| 5.0M+ | ~1,200–1,500 | ~3–4% | 3BR+ |
The pattern is familiar, but important to restate.
Nearly 70% of transactions sit between AED 0.75M and AED 3.0M, with the single largest band at AED 1.0M–1.5M. This is the part of the market where pricing aligns most comfortably with buyer capacity.
Below AED 1M, the market is studio-led. These are entry points, often tied to investors seeking lower capital deployment and higher rental flexibility.
Between AED 1M and AED 2M, the market becomes clearly 1BR-driven. This is the most active segment, where both investors and first-time end-users converge. It is also where off-plan activity is most concentrated, supported by payment plans that make these tickets accessible.
Beyond AED 2M, the structure begins to shift. 2BR units take over as the dominant configuration, reflecting a transition toward more space-driven purchases. However, volume starts to thin out.
Above AED 5M, the market becomes selective. Transactions exist, but they do not drive the quarter. This segment carries narrative weight, but not volume weight.
Another layer emerges when we connect this to earlier sections.
- The dominance of compact configurations aligns with the <2M bands
- The stability in pricing reflects the concentration within these bands
- The strength of off-plan is most visible between AED 1M and AED 3M
This is where the system holds together.
What Q1 shows clearly is that the market is not expanding outward in terms of affordability. It is consolidating around a band that continues to absorb demand efficiently.
Buyers are not stretching into higher tickets at scale.
Nor are they retreating into lower ones.
They are transacting where:
- pricing feels manageable
- product is available
- and exit pathways remain clear
That is what defines the centre of the market.
Buyer Profile & Demand Lens – Q1 2026
By this point, the data has already outlined the structure. What remains is to read who is behind it, not in demographic terms, but in behaviour.
Q1 does not point to a single dominant buyer. It reveals a layered demand system, where different segments operate within their own logic but intersect around the same price and product bands.
The first and most visible layer is the investor-led segment. This shows up clearly through the dominance of studios and 1BR units, which together account for nearly 67% of all transactions. These formats offer a familiar equation: lower entry capital, predictable rental demand, and relatively straightforward resale pathways.
The strength of off-plan further reinforces this behaviour. With 75.64% of transactions occurring in projects under construction, a large share of buyers are choosing structured entry over immediate ownership. They are committing to a timeline, aligning with payment plans, and positioning themselves for future delivery rather than present use.
This is not speculative behaviour in the traditional sense. It is structured participation, where capital is deployed gradually rather than upfront.
The second layer is the end-user or utility-driven buyer.
This segment is less visible in volume, but clearer in behaviour. It appears more prominently in the ready market and in configurations where space begins to matter more than entry price.
The configuration split supports this. Ready transactions show a relatively higher share of 2BR and 3BR units compared to off-plan. These are not the easiest units to transact, but they align more closely with lived requirements.
For this buyer, the decision is less about timing and more about certainty:
- immediate occupancy
- established communities
- known building quality
This creates a quieter but important counterbalance to the investor-driven off-plan activity.
The third layer sits between these two — the upgrader.
This is where the market transitions from compact formats to larger homes, typically within the AED 2M–4M range. It is not the largest segment by volume, but it plays a key role in shaping the upper-mid market.
These buyers are not entering the market for the first time, nor are they purely investment-driven. They are moving within the system, often trading up from smaller units or repositioning based on lifestyle needs.
This is where:
- 2BR units become dominant
- ticket sizes begin to expand
- project selection becomes more specific
What connects all three layers is the band within which they operate.
The AED 0.75M–3.0M range, which carries the majority of transactions, acts as a shared ground where:
- investors find liquidity
- end-users find accessibility
- upgraders find transition
This overlap is what keeps the market cohesive.
Q1 does not show a market dominated by one type of buyer.
It shows a system where:
- investors drive volume
- end-users anchor stability
- upgraders shape progression
Each segment operates differently, but they converge within the same structure.
That convergence is what allows the market to remain active without becoming unstable.
Rental Trends & Yield Outlook – Q1 2026
If the sales data tells us how capital is moving, the rental market tells us whether that capital is supported by income. In Q1, that support is clearly present.
The quarter records 149,423 rental contracts for apartments, a scale that is more than four times the sales volume. This imbalance is not unusual for Dubai, but it is important. It reinforces that the market is not just transactional. It is actively occupied.
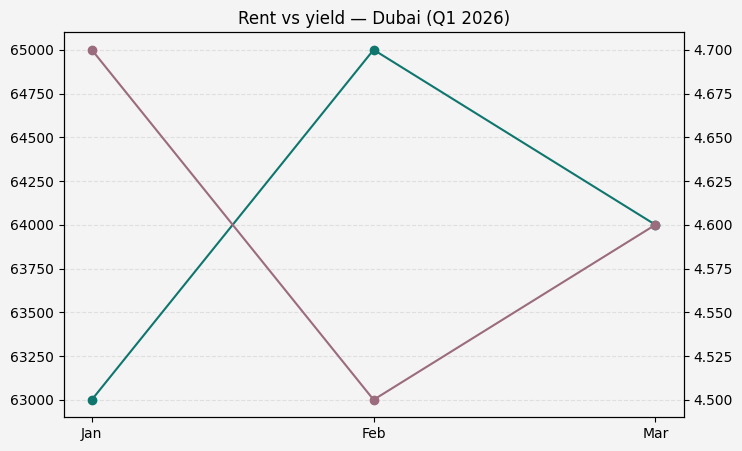
| Metric | Q1 2026 |
| Rental contracts | 149,423 |
| Median annual rent | AED 64,000 |
| Implied gross yield | ~4.6% |
The monthly pattern mirrors what we saw on the sales side. Activity is strongest in January, holds in February, and moderates in March. The decline is visible, but again, it is controlled rather than abrupt. It reflects normal leasing cycles rather than a drop in demand.
| Month | Contracts |
| January | 58,744 |
| February | 51,638 |
| March | 39,041 |
The median rent of AED 64,000 sits comfortably within the same affordability band that dominates sales. This alignment is important. It indicates that the market’s pricing is not detached from its rental base.
At the aggregate level, this translates into an implied gross yield of roughly 4.6%. This is not a high-yield environment, but it is not compressed either. It sits in a range that allows the market to function without relying purely on capital appreciation.
What matters more is where this yield is coming from.
The rental base is heavily aligned with the same segments that dominate transactions — studios and 1BR units. These formats are easier to lease, more widely demanded, and more consistent in occupancy. This is why they continue to act as both the liquidity engine in sales and the income base in rentals.
There is, however, an important structural nuance.
Off-plan pricing sits above ready pricing, while rental income is tied to delivered inventory. This creates a natural pressure point. If pricing continues to firm in off-plan while rents remain stable, yields tend to compress first in the most traded segments.
Q1 does not show that pressure clearly yet, but it sets up the condition for it.
The market, at this stage, is balanced:
- Rental demand is deep
- Pricing is stable
- Yields are moderate but viable
This balance is what allows investor participation to continue without requiring aggressive price growth.
The broader takeaway is simple.
The market is not being sustained by expectation alone.
It is supported by actual usage and income.
That is what keeps Q1 grounded, even as transaction volumes fluctuate.
Configuration Spotlight – Project-Level Breakdown
A configuration view tells us what sold. A project view tells us where that demand pooled, and how differently projects are positioning the same bedroom count in terms of pricing, ticket size, and unit sizing.
For Q1, this section leans toward off-plan, where project-level tagging is clean and comparable.
Studios (Off-plan)
Studios remain the market’s most repeatable product. What stands out is the spread in positioning even within similar unit sizes. The variation within studios alone shows how pricing is driven less by size and more by positioning.
| Project | Transactions | Share | Median AED/psf | Median ticket (AED) | Median size |
| MAYBACH SIX | 523 | 8.1% | 3,609 | 1,386,000 | 387 sqft |
| BINGHATTI VINTAGE | 464 | 7.2% | 1,861 | 696,000 | 373 sqft |
| SAMANA BOULEVARD HEIGHTS | 186 | 2.9% | 1,720 | 726,533 | 419 sqft |
| BINGHATTI CULLINAN | 176 | 2.7% | 2,207 | 849,039 | 383 sqft |
| BREEZ BY DANUBE | 139 | 2.1% | 3,477 | 1,382,400 | 395 sqft |
Despite similar sizes, pricing ranges from sub-AED 700K to well above AED 1.3M. This is not a product difference. It is positioning.
1BR (Off-plan)
The 1BR segment carries the market’s core liquidity. Here, variation shifts from entry vs premium into mid-market vs upper-mid positioning.
| Project | Transactions | Share | Median AED/psf | Median ticket (AED) | Median size |
| HADO BY BEYOND | 299 | 2.8% | 3,098 | 2,585,000 | 832 sqft |
| SKYVUE | 162 | 1.5% | 2,983 | 1,819,228 | 627 sqft |
| KANYON BY BEYOND | 156 | 1.4% | 2,845 | 2,579,500 | 919 sqft |
| DAMAC RIVERSIDE VIEWS – AZURE 2 | 150 | 1.4% | 1,441 | 1,223,500 | 855 sqft |
| SIERRA BY IMAN | 128 | 1.2% | 1,640 | 1,324,204 | 791 sqft |
Here, ticket sizes range from AED 1.2M to AED 2.5M+. The divergence is not just pricing — it is product scale and positioning.
2BR (Off-plan)
2BRs act as the market’s balance point, bridging investor demand and end-user intent.
| Project | Transactions | Share | Median AED/psf | Median ticket (AED) | Median size |
| HADO BY BEYOND | 166 | 2.5% | 3,346 | 4,266,500 | 1,236 sqft |
| WINDSOR HOUSE | 118 | 1.8% | 1,432 | 1,644,828 | 1,134 sqft |
| CREEK HAVEN | 112 | 1.7% | 2,844 | 3,392,388 | 1,194 sqft |
| SKYVUE | 102 | 1.5% | 3,055 | 2,676,840 | 881 sqft |
| WINDSOR HOUSE II | 94 | 1.4% | 1,512 | 1,743,328 | 1,137 sqft |
The split is clear:
- Mid-market 2BR → AED 1.6M–1.8M
- Premium 2BR → AED 2.5M–4M+
This is where the market begins to separate into two speeds.
3BR (Off-plan leaders)
Volume thins, but variation expands.
| Project | Transactions | Share | Median AED/psf | Median ticket (AED) | Median size |
| HADO BY BEYOND | 49 | 3.2% | 3,555 | 7,302,000 | 2,008 sqft |
| NOURELLE | 41 | 2.7% | 2,899 | 6,500,000 | 2,224 sqft |
| CAPRIA WEST | 31 | 2.0% | 2,017 | 6,529,000 | 2,780 sqft |
| PASSO BY BEYOND | 29 | 1.9% | 7,053 | 13,519,000 | 1,884 sqft |
| SILVA | 27 | 1.7% | 2,174 | 4,053,888 | 1,834 sqft |
This is no longer a uniform market. It is project-led pricing, where location, brand, and positioning dominate.
3BR+ (Off-plan leaders)
This is the most selective layer.
| Project | Transactions | Share | Median AED/psf | Median ticket (AED) | Median size |
| PALM CENTRAL PRIVATE RESIDENCES | 16 | 8.9% | 3,291 | 14,780,000 | 3,981 sqft |
| SIERRA BY IMAN | 14 | 7.8% | 1,094 | 4,220,064 | 3,862 sqft |
| AVARRA BY PALACE | 11 | 6.1% | 3,183 | 13,886,619 | 4,435 sqft |
| PASSO BY BEYOND | 6 | 3.3% | 7,756 | 42,248,925 | 5,924 sqft |
| SOLARA TOWER DUBAI | 6 | 3.3% | 4,630 | 21,371,000 | 4,201 sqft |
At this level, pricing is no longer anchored to configuration. It is entirely asset-specific.
What This Section Reveals
Across configurations, one pattern repeats:
- Same bedroom count
- Similar sizes
- Very different prices
This is not inefficiency.
👉 This is intentional positioning
AIQYA Insight
This is where the market becomes a two-speed system:
- Compact units → liquidity engine
- Larger units → lifestyle ballast
And within each:
👉 projects define pricing more than configuration
Risks & Watchpoints – Q1 2026
Q1 does not present immediate stress signals. The market is active, pricing is stable, and demand is clearly distributed. But beneath this balance, there are a few structural dependencies worth watching.
The first sits in the dominance of off-plan.
With over 75% of transactions tied to projects under construction, the market is heavily dependent on continued buyer confidence in delivery timelines, developer credibility, and payment structures. This works well when launches are absorbed smoothly, but it also means that any disruption in supply cycles or sentiment can have a disproportionate impact on transaction flow.
This is not a risk in isolation. It is a condition that requires continuity.
The second sits in pricing versus rental alignment.
At an aggregate level, yields remain in a workable range at around 4.5%–5%. But as we saw in the configuration spotlight, off-plan pricing in several projects is already positioning at a premium, even within compact configurations.
Rental income, however, is tied to delivered stock and tends to move more gradually.
If pricing continues to firm in off-plan while rents remain steady, the first place this shows up is not in prices falling, but in yield compression, particularly in the most traded segments like studios and 1BRs.
This is a slow signal, but an important one.
The third is concentration within compact units.
Nearly two-thirds of transactions sit within studios and 1BRs. This creates liquidity, but it also creates dependence. If demand in this segment slows — whether due to pricing, supply saturation, or external factors — the broader market will feel it quickly.
At the same time, larger configurations do not yet have the volume to offset that shift.
The fourth is project-level dispersion.
While Q1 shows healthy distribution across multiple projects, it also reveals how much pricing and positioning are being driven at the project level rather than at a broader market level.
This means:
- comparability becomes harder
- pricing gaps widen within the same configuration
- and buyer decision-making becomes more dependent on individual project narratives
This is not instability, but it is complexity.
The final layer is cycle sensitivity.
Both sales and rental activity show a similar pattern — strong early in the quarter, moderating toward March. On its own, this is not unusual. But it reinforces that the market operates in cycles of absorption, not continuous acceleration.
In a steady environment, this creates rhythm.
In a volatile environment, it can amplify slowdowns.
What Q1 ultimately shows is a market that is stable, but structurally dependent on a few key drivers:
- continued off-plan absorption
- alignment between price and rent
- sustained demand in compact units
- and consistent launch pipelines
None of these are immediate risks.
But they are the conditions that hold the system together.
Supply Snapshot – What’s in the Pipeline
If Q1 confirms anything clearly, it is that the pipeline is not a background story. It is the market.
With 75.64% of apartment transactions in off-plan, future supply is already being absorbed well before delivery. That makes pipeline reading less about counting launches and more about understanding what kind of product is being taken up most easily.
The answer, at least for this quarter, is clear. The strongest absorption continues to sit in compact formats. Studios and 1BRs dominate transaction activity, and off-plan supply is aligned closely with that demand. Developers are not testing the market with broad experimentation. They are largely feeding the segments that already provide liquidity.
That is the first signal.
The second is breadth. Q1 is not dependent on one flagship launch or one project cycle. Volume is spread across a range of developments, with the top off-plan projects contributing meaningfully but not overwhelmingly. That matters because a pipeline supported by many active projects is usually healthier than one driven by a single burst of concentrated supply.
In practical terms, this means the market is not just receiving more stock. It is receiving repeatable stock — compact, price-banded, payment-plan-friendly inventory that fits the way buyers are currently entering the market.
This supports continuity, but it also creates a watchpoint.
A pipeline that keeps producing the same narrow product mix can sustain liquidity for a time, but it also increases the market’s dependence on a specific buyer profile. If investor appetite weakens, or if yield pressure begins to build in compact segments, supply can start arriving into a more selective market.
That is not today’s problem. But it is tomorrow’s question.
The ready market adds another layer to this. Delivered stock remains smaller in transaction share, yet it continues to serve as the market’s anchor for current usability. This means the pipeline is not replacing the ready segment. It is running alongside it, shaping expectations while the ready market continues to define lived value.
What Q1 ultimately suggests is that the pipeline remains broadly aligned with current demand. Developers are not pushing product far outside the market’s comfort zone. They are reinforcing what is already working.
That gives the market resilience.
But it also means that future balance will depend on how well:
- compact off-plan supply continues to clear
- rental income keeps pace with new pricing
- and demand remains broad enough to absorb incoming stock without forcing repricing
For now, the pipeline is not overwhelming the market.
It is moving with it.
The system is not accelerating. It is holding.
Final Observations & Buyer Takeaways
Q1 2026 closes with a market that feels organised rather than overheated. Activity remains strong at the apartment level, pricing holds within a defined band, and demand continues to cluster around formats that are easy to enter and easy to absorb. Nothing in the quarter suggests a market chasing excess. If anything, the data points to a system that knows where its centre lies.
That centre is clear. It sits in compact apartments, in the AED 1M–2M band, and increasingly in off-plan projects that allow buyers to spread commitment over time. This is where liquidity is concentrated, and it is where the market continues to find its rhythm.
For investors, the message is straightforward. Studios and 1BRs remain the most legible part of the market. They account for the majority of transactions, align most closely with the rental base, and continue to offer the easiest entry and exit pathways. But that liquidity comes with a discipline of its own. In several projects, off-plan pricing is already stretching ahead of the broader market. The question is no longer whether compact units will sell. It is whether rental growth can keep pace with the prices now being asked for them.
For end-users, the ready market remains the quieter but more grounded lane. It is smaller in share, but it offers what off-plan cannot: immediacy, known quality, and existing community context. Buyers prioritising certainty over staged commitment may find that this part of the market still offers a clearer read on real livability, even if it sits outside the quarter’s dominant momentum.
For upgraders, Q1 reinforces that the transition point sits in 2BRs. This is where the market begins to move away from pure liquidity and toward more specific lifestyle decisions. Beyond this, project selection matters more than quarter-wide medians. Pricing becomes less about broad market movement and more about what a given project is promising in exchange for the ticket it commands.
The larger takeaway is that Dubai’s apartment market is currently being supported by three forces at once: investor-friendly compact units, developer-led off-plan supply, and a rental base large enough to keep the system grounded in actual use. That combination is what gives Q1 its balance.
The watchpoints remain clear. Off-plan dominance needs continued absorption. Compact units need rents to keep pace with pricing. And the market as a whole remains sensitive to the launch cycle that currently drives most of its volume.
But for now, the structure holds.
Q1 is not a quarter of reinvention.
It is a quarter of reinforcement.
And in a market like Dubai, that can matter more.
Data Source Attribution
This report is based on official registered transaction records from the Dubai Land Department, alongside registered rental contract data used for the rental and yield layer.
Scope
- Geography: Dubai
- Period covered: Q1 2026, from January 1 to March 31, 2026
- Core sales scope: Residential, Freehold, Unit, Flat transactions
- Core rental scope: Residential, Freehold, Unit, Flat and Studio rental contracts
Sales procedures included
- Sale
- Sell – Pre registration
- Sale on Payment Plan
Excluded from core apartment sales scope
- Villas
- Townhouses
- Plots / land
- Hotel apartments
- Commercial assets
- Mortgages, grants, delayed sell, lease-to-own, and other non-sale procedures
Price metric
- AED per square foot is calculated as:
TRANS_VALUE / (ACTUAL_AREA × 10.7639)
Deduplication
- Sales: Transaction-level cleaning applied using the rule
Transaction Number + Project Name + Registration Date + Area - Rentals: Deduplication applied using
Project + Registration Date + Annual Amount + Area
Notes
- Off-plan versus ready segmentation is taken directly from the source field, with no manual overrides
- Rental yields are indicative gross yields derived from median annual rent against median sale ticket
- Studios in rental data were included separately to avoid undercounting compact rental stock
- Minor gaps may exist where project names are missing or inconsistently tagged in source exports, especially within parts of the ready dataset
Disclaimer
Figures are based on official registered datasets. Minor gaps may exist due to naming inconsistencies, missing fields, or classification limitations in the source export. This report is intended for insight and education, not financial advice.
Dubai Q4 2025 Apartment Market Report: Off-plan Dominance, Pricing, and Buyer Signals