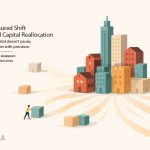
Business Bay Real Estate H1 2025 reveals a corridor that thrives on liquidity and rhythm. Across the first half of the year, the district logged 3,721 residential sales worth AED 8.3 billion, cementing its role as one of Dubai’s most active investment hubs. Compact studios and one-beds drove over 70% of activity, powering churn and yield, while larger apartments and branded towers provided lifestyle ballast. Off-plan launches dominated with a 69% share, yet more than 1,100 ready sales proved that secondary liquidity remains strong, making Business Bay a market where investors and end-users continue to find common ground.
- Market Overview – Business Bay, H1 2025
- Key Market Metrics – Business Bay, H1 2025
- Price Trends & Market Interpretation – Business Bay, H1 2025
- Primary vs Secondary Market Composition – Business Bay, H1 2025
- Configuration Distribution – What Are Buyers Choosing?
- Unit Size Trends & Market Signals – Business Bay, H1 2025
- Top Projects & Developer Activity – Business Bay, H1 2025
- Affordability Snapshot – Where Buyers Are Spending
- Buyer Profile & Demand Lens – Business Bay, H1 2025
- Rental Trends & Yield Outlook – Business Bay, H1 2025
- Configuration Spotlight – Project-Wise Breakdown
- Risks & Watchpoints – Business Bay, H1 2025
- Supply Snapshot – What’s in the Pipeline?
- Plot Transactions & Investment Signals – Business Bay, H1 2025
- Final Observations & Buyer Takeaways – Business Bay, H1 2025
- Data Source Attribution
Market Overview – Business Bay, H1 2025
Business Bay remains Dubai’s engine room of liquidity, a place where numbers rarely sleep and compact units change hands with relentless rhythm. In the first half of 2025, the district recorded 3,721 residential sales worth AED 8.3 billion, a scale that places it firmly among the city’s most active corridors.
Prices stayed anchored at a median of AED 2,372 per sq.ft., high enough to signal premium positioning, yet stable enough to reassure investors that the market can digest new launches without overheating. Volumes climbed from 1,679 in Q1 to 2,042 in Q2, a rise of more than 20 percent, while prices softened only fractionally. It is a picture of orderly growth: demand expanding, supply flowing in, equilibrium maintained.
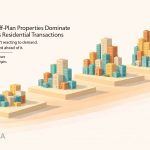
The composition tilted toward the off-plan market (69%), where developers continue to churn out studio and one-bedroom launches that investors quickly absorb. The ready market (31%) still held weight, reflecting liquidity in completed towers that have long defined the skyline. Together, studios and 1 BRs formed over 70 percent of transactions, a clear signal that Business Bay trades less in sprawling homes and more in churnable, compact formats that keep the wheels of liquidity turning.
Business Bay is less a lifestyle haven and more a market machine, where compact units dominate, investors find quick entry and exit, and volumes rise without unsettling price stability.
🧭 AIQYA Insight
For investors, the story is straightforward: a corridor that rewards those seeking yield and liquidity rather than space. For end-users, Business Bay offers immediacy and centrality, but rarely serenity. It is Dubai’s reminder that in some districts, it is churn, not charm, that defines the market pulse.
Key Market Metrics – Business Bay, H1 2025
Numbers often tell a story of their own, and in Business Bay they read like the ledger of a restless marketplace. Transactions kept pace with the skyline, steady, tall, and unrelenting. By the close of H1 2025, 3,721 homes had changed hands, carrying a total value of AED 8.3 billion. The heartbeat was quick but not erratic: prices held to a narrow band, signalling confidence rather than frenzy.
Business Bay Snapshot (H1 2025 – Residential Flats + Villas)
| Metric | H1 2025 | Q1 2025 | Q2 2025 |
| Transactions | 3,721 | 1,679 | 2,042 |
| Total Value (AED) | 8.29B | 3.42B | 4.87B |
| Median Price (AED/sq.ft.) | 2,372 | 2,385 | 2,360 |
| Average Price (AED/sq.ft.) | 2,358 | 2,377 | 2,342 |
| Off-plan Share | 69% | – | – |
| Ready Share | 31% | – | – |
- Nearly AED 5 billion worth of deals closed in Q2, a step up from Q1’s AED 3.4B, showing the corridor’s capacity to absorb supply in stride.
- Median psf barely shifted between quarters (2,385 → 2,360), proof that demand kept balance with deliveries.
- Off-plan launches drove two-thirds of activity, but the ready segment still turned over more than a thousand homes, liquidity across both spectrums.
🧭 AIQYA Insight
Business Bay is a market of momentum, not spikes. Its value lies in sheer scale and a pricing band investors can trust. For end-users, this consistency is reassuring but also revealing: here, the narrative is not about sprawling villas or lifestyle enclaves, but about a district engineered to keep deals flowing.
Price Trends & Market Interpretation – Business Bay, H1 2025
Prices in Business Bay traced a remarkably narrow path through the first half of 2025. The median shifted only 1%, from AED 2,385 per sq.ft. in Q1 to AED 2,360 per sq.ft. in Q2, even as volumes rose by more than 20 percent.
Business Bay Price Trend (H1 2025 – Residential Flats + Villas)
| Quarter | Median Price (AED/sq.ft.) | Average Price (AED/sq.ft.) | Transactions |
| Q1 2025 | 2,385 | 2,377 | 1,679 |
| Q2 2025 | 2,360 | 2,342 | 2,042 |
| H1 2025 | 2,372 | 2,358 | 3,721 |
- Price stability under volume growth: While deal activity surged in Q2, prices barely moved, signalling a market with depth rather than volatility.
- Premium corridor positioning: At ~AED 2,370 per sq.ft., Business Bay sits just below Downtown’s ultra-prime median (~AED 2,430) but comfortably above affordability-led corridors like JVC (~AED 1,430).
- Investor comfort zone: This stability creates predictability, a trait prized by overseas investors who rely on liquidity rather than sharp capital gains.
🧭 AIQYA Insight
Business Bay doesn’t trade in drama, it trades in consistency. Investors can enter knowing the district absorbs supply without price shocks. For end-users, this signals a market where values are unlikely to collapse, but also unlikely to offer bargain entry. It is the middle ground of Dubai’s premium spectrum: not as rarefied as Downtown, not as volatile as emerging corridors, but steady in its own liquidity-first rhythm.
Primary vs Secondary Market Composition – Business Bay, H1 2025
Liquidity in Business Bay leaned heavily toward the off-plan market, where new launches continue to draw investors into compact formats. Yet the ready segment still carried meaningful weight, showing that Business Bay is not only about future promises but also about the steady churn of lived-in towers.
Business Bay Market Split (H1 2025 – Residential Flats + Villas)
| Market Type | Transactions | Share of H1 2025 (%) |
| Off-plan (Primary) | 2,566 | 69% |
| Ready (Secondary) | 1,155 | 31% |
| Total | 3,721 | 100% |
- Developer dominance: Nearly seven out of ten homes sold in H1 were off-plan, reflecting the corridor’s role as an investor’s playground.
- Ready liquidity: More than 1,100 transactions in completed stock underline the depth of demand, towers like Executive Bay, Ontario Tower, and Capital Bay still trade actively, keeping the resale channel alive.
- Balanced confidence: The presence of both launch-driven absorption and resale churn indicates that Business Bay attracts buyers across timelines, some betting on delivery, others preferring immediate possession.
🧭 AIQYA Insight
Business Bay’s dual rhythm, speculative energy in the off-plan stream and dependable liquidity in the ready stream, is what sustains its scale. For investors, off-plan offers accessible entry tickets with yield potential. For end-users, the ready stock provides a tested address in Dubai’s central grid. It is this interplay of promise and possession that keeps Business Bay liquid even as volumes swell.
Configuration Distribution – What Are Buyers Choosing?
Business Bay’s demand curve is written in its compact footprints. Studios and one-bedroom apartments were the workhorses of H1 2025, together capturing more than 70% of all sales. Larger apartments and villas made their presence felt, but in far smaller numbers, serving more as lifestyle anchors than liquidity engines.
Business Bay Configuration Split (H1 2025 – Residential Flats + Villas)
| Configuration | Transactions | Share of H1 2025 (%) |
| Studio | ~1,200 | 32% |
| 1 BR | ~1,450 | 39% |
| 2 BR | ~730 | 20% |
| 3 BR | ~220 | 6% |
| 4 BR+ (incl. Villas) | ~121 | 3% |
| Total | 3,721 | 100% |
- Studios (32%) – The pure liquidity play: median 440 sq.ft., ~AED 1.1M, ~AED 2,500 psf.
- 1BRs (39%) – The corridor’s backbone: median 830 sq.ft., ~AED 1.8M, ~AED 2,250 psf.
- 2BRs (20%) – The bridge between yield and lifestyle: ~1,400 sq.ft., ~AED 2.75M.
- 3BRs (6%) – Sparse, but meaningful for upgraders: ~2,320 sq.ft., ~AED 3.9M.
- 4BR+ (3%) – A niche that includes villas and penthouses, ~4,300+ sq.ft., often trading above AED 9M.
🧭 AIQYA Insight
The configuration split tells us Business Bay is an investor’s corridor first, an end-user’s address second. Compact units act as the liquidity engine, with studios (~AED 1.1M entry) and one-beds (~AED 1.8M) giving investors quick entry into Dubai’s central grid.
For comparison, Downtown skews higher into 2–3BR formats, reflecting its role as a lifestyle destination, while JVC leans toward affordability-driven 1–2BR volumes. Business Bay sits between these two poles, more premium than JVC, more compact than Downtown.
The risk is oversupply in 1BR launches, which could compress rents if absorption slows. But the upside is clear: compact churn here remains unmatched, making Business Bay a benchmark for liquidity-driven investment in Dubai.
Unit Size Trends & Market Signals – Business Bay, H1 2025
In Business Bay, size often dictates both ticket and intent. The smaller the home, the faster it moves; the larger the home, the rarer the buyer. The numbers reveal a market where most deals cluster below 1,000 sq.ft., with larger formats trading in much smaller volumes but commanding sharp jumps in ticket sizes.
Business Bay – Median Unit Size vs Ticket (H1 2025, Residential Flats + Villas)
| Configuration | Median Size (sq.ft.) | Median Ticket (AED) | Median Price (AED/sq.ft.) |
| Studio | ~440 | ~1.1M | ~2,500 |
| 1 BR | ~830 | ~1.8M | ~2,250 |
| 2 BR | ~1,410 | ~2.75M | ~2,165 |
| 3 BR | ~2,320 | ~3.9M | ~1,750 |
| 4 BR+ (incl. Villas) | ~4,320 | ~9.0M | ~2,080 |
- Compacts dominate: most transactions are in studios and 1BRs under 1,000 sq.ft., keeping entry costs accessible.
- Step-up formats: 2BRs add ~600 sq.ft. but almost double the ticket, a clear inflection point between investor and end-user demand.
- Large formats thin out: 3BR and 4BR+ homes see fewer sales but pull values above AED 3.5–9M, reflecting their niche role.
🧭 AIQYA Insight
Unit size signals market psychology. Studios and 1BRs thrive as the churnable stock, easy to lease and liquidate. They are the “liquidity engine” that keeps Business Bay moving.
At the 2BR level, the buyer profile shifts; these are often couples or small families willing to stretch budgets for centrality. Beyond that, 3BR and 4BR+ homes live in a different orbit: low turnover, high service charges, but symbolic for developers who want to showcase premium positioning.
Compared with Downtown, Business Bay’s larger homes trade at thinner volumes, reinforcing its identity as an investor corridor. But unlike JVC, where unit sizes are larger in the mid-market, Business Bay’s compacts show that yield and accessibility drive its pulse.
Top Projects & Developer Activity – Business Bay, H1 2025
Business Bay’s skyline may look uniform from a distance, but the sales charts tell a sharper story, a handful of projects captured the lion’s share of transactions in H1 2025. Off-plan launches powered by marketing muscle and price-point engineering dominated the leaderboard, while a few legacy towers in the resale market kept the secondary channel alive.
Business Bay – Top Projects by Transactions (H1 2025, Residential Flats + Villas)
| Rank | Project | Transactions | Market Type | Median Price (AED/sq.ft.) | Median Ticket (AED) |
| 1 | Binghatti Skyrise | ~760 | Off-plan | ~2,480 | ~1.1M |
| 2 | Bayz 102 (Danube) | ~300 | Off-plan | ~2,770 | ~1.4M |
| 3 | Rove Home Marasi | ~100 | Off-plan | ~3,550 | ~1.6M |
| 4 | Al Habtoor Tower | ~220 | Off-plan | ~2,150 | ~3.3M |
| 5 | Capital Bay Towers | ~85 | Ready | ~1,650 | ~1.9M |
| 6 | Ontario Tower | ~70 | Ready | ~1,450 | ~1.2M |
| 7 | Executive Bay | ~65 | Ready | ~1,480 | ~1.4M |
| 8 | Ubora Tower | ~60 | Ready | ~1,520 | ~1.8M |
(Projects beyond the top 8 have smaller volumes, spread across mixed ready stock.)
- Launch-led dominance: Binghatti Skyrise alone delivered over 20% of all H1 sales, proving how concentrated absorption can be in a single off-plan tower.
- Mid-ticket sweet spot: Bayz 102 and Rove Home Marasi show the corridor’s appetite for branded, compact units priced between AED 1.1–1.6M.
- Prestige edge: Al Habtoor Tower, with higher median tickets, catered to upper-mid investors and some aspirational end-users.
- Resale liquidity: Ready towers like Capital Bay and Ontario Tower still churned meaningfully, underlining that resale isn’t eclipsed by launches.
🧭 AIQYA Insight
Business Bay’s developer activity underscores its investor DNA. Off-plan dominates not just in volume but in visibility, with towers like Skyrise and Bayz turning into churn machines. The ready segment’s resilience shows that legacy stock retains relevance, giving investors a second channel to exit or enter without waiting for handovers. Compared with Downtown’s luxury-led launches or JVC’s affordability clusters, Business Bay’s mix reveals a compact-premium niche: small homes, mid-range tickets, and steady liquidity.
Affordability Snapshot – Where Buyers Are Spending
Behind the glass towers and marketing gloss, Business Bay’s transactions cluster firmly in the mid-market. Most buyers here are not chasing trophy penthouses but compact homes priced under AED 1.5M, keeping the district firmly in the investor-accessible bracket. Higher-ticket deals exist, especially in large 3–4BR formats and select branded towers, but they remain the minority.
Business Bay – Ticket Size Distribution (H1 2025, Residential Flats + Villas)
| Ticket Band | Transactions | Share of H1 2025 (%) |
| < AED 0.75M | ~520 | 14% |
| AED 0.75M – 1.5M | ~1,380 | 37% |
| AED 1.5M – 3M | ~1,115 | 30% |
| AED 3M – 5M | ~445 | 12% |
| AED 5M+ | ~260 | 7% |
| Total | 3,721 | 100% |
- Nearly half the market (51%) trades below AED 1.5M, reinforcing Business Bay’s appeal as an investor corridor.
- The AED 1.5–3M band (30%) is dominated by 2BR formats, bridging investor and end-user demand.
- Deals above AED 5M make up only 7%, showing that luxury remains a niche rather than the district’s identity.
🧭 AIQYA Insight
Affordability defines Business Bay’s liquidity. With entry points around AED 1M, the district attracts regional investors, younger buyers, and overseas landlords seeking short-let yields. Compared with Downtown, where a majority of deals sit above AED 3M, Business Bay offers a mid-range premium slot: accessible enough to churn, central enough to hold value. The risk lies in saturation of the AED 1–1.5M band, but its resilience so far confirms that this corridor is built on volume, not on prestige.
Buyer Profile & Demand Lens – Business Bay, H1 2025
Business Bay’s numbers tell us more than where money flows; they hint at who is buying and why. With over half of sales below AED 1.5M, the corridor speaks directly to investors seeking predictable yields and to younger buyers stepping onto Dubai’s property ladder. At the other end, a smaller but visible layer of larger deals reflects families and end-users who value centrality over space.
- Investors dominate: Compact studios and 1BRs, priced around AED 1.1–1.8M, fit the yield playbook for both local and overseas landlords.
- Young professionals / first-time buyers: A central address at a lower ticket price makes Business Bay attractive to those priced out of Downtown or DIFC.
- End-users and upgraders: 2BR and 3BR sales, though smaller in volume, show that Business Bay also hosts families who prioritise access to the city’s core.
- Lifestyle buyers: A niche group looking at 4BR+ units and villas, often paying AED 9M+, signalling status more than liquidity.
🧭 AIQYA Insight
Business Bay’s buyer lens reinforces its dual identity: a fast-moving investor corridor built on compacts, and a secondary but important hub for central-living families. Compared with JVC, where affordability is the pull, and Downtown, where prestige defines demand, Business Bay balances accessibility with centrality. It is neither the cheapest nor the most luxurious, but it offers an address that works across investor, upgrader, and young-professional segments. This layered demand is what keeps volumes high and prices steady, even in the face of heavy new supply.
Rental Trends & Yield Outlook – Business Bay, H1 2025
Leasing data confirms what sales already suggested: Business Bay thrives on compact formats, but rental yields are moderating as supply deepens. Studios and one-beds remain the most liquid in the lease market, though their yields have softened slightly compared with prior quarters. Larger units continue to carry thinner returns, underlining their role as lifestyle ballast rather than yield engines.
Business Bay – Median Rents & Gross Yields (H1 2025, Residential Flats + Villas)
| Configuration | Median Annual Rent (AED) | Median Sale Price (AED) | Gross Yield (%) |
| Studio | ~55,000 | ~1.1M | 5.0% |
| 1 BR | ~80,000 | ~1.8M | 4.4% |
| 2 BR | ~120,000 | ~2.75M | 4.4% |
| 3 BR | ~165,000 | ~3.9M | 4.2% |
| 4 BR+ | ~240,000 | ~9.0M | 2.7% |
- Compacts still lead: Studios (~AED 55k) and 1BRs (~AED 80k) are the most sought-after rentals, though yields have eased to ~5% and ~4.4%.
- 2–3BRs hold mid-yield range: At ~4.2–4.4%, these units appeal more to end-users than yield-seekers.
- 4BR+ homes underperform: Returns dip to ~2.7%, positioning them as prestige or family homes rather than income assets.
🧭 AIQYA Insight
Business Bay’s yield story is one of stability with gentle softening. Investors can still rely on 5% returns in compact formats, but the golden 6%+ yields are now harder to find. This reflects a maturing market where supply has caught up with rental demand. Compared with Downtown (yields ~3.5–4% in large units) and JVC (yields ~6% in affordable formats), Business Bay sits in the middle band, central enough to reassure investors, yet accessible enough to keep volumes high.
Configuration Spotlight – Project-Wise Breakdown
A closer look at leading projects shows how developers have calibrated Business Bay’s pulse: heavy on compacts, lighter on lifestyle formats. The most active towers leaned strongly toward studios and one-beds, while only a few delivered meaningful volumes in larger homes.
Business Bay – Configuration Mix in Top Projects (H1 2025)
| Project | Studios | 1 BR | 2 BR | 3 BR+ | Notable Trend |
| Binghatti Skyrise | ~420 | ~280 | ~60 | ~0 | Studio-led absorption, entry-level churn |
| Bayz 102 (Danube) | ~140 | ~120 | ~40 | ~0 | Balanced between studios & 1BRs |
| Rove Home Marasi | ~65 | ~30 | ~5 | ~0 | Branding-driven studio appeal |
| Al Habtoor Tower | ~0 | ~75 | ~95 | ~50 | Larger units, premium positioning |
| Capital Bay Towers (Ready) | ~20 | ~40 | ~20 | ~5 | Secondary market liquidity |
(Rounded numbers, based on SSOT dataset splits.)
- Studio-heavy launches like Binghatti Skyrise shaped the overall corridor profile, feeding investor-driven demand.
- Balanced formats in Bayz 102 show developers hedging slightly toward 2BRs, offering entry for small families.
- Brand-driven projects such as Rove Home leaned compact, reinforcing Business Bay’s investor DNA.
- Al Habtoor Tower stood apart, with a tilt toward 2–3BR units, catering to end-users seeking larger homes within the district.
🧭 AIQYA Insight
The configuration breakdown highlights Business Bay’s developer calculus: keep volumes high with compacts, but sprinkle prestige with larger formats in marquee towers. This duality sustains liquidity while still giving the corridor aspirational value. Compared with Downtown, where 2–3BRs dominate, and JVC, where affordability drives 1–2BR absorption, Business Bay finds its edge in studio and 1BR churn, backed by selective lifestyle anchors.
Risks & Watchpoints – Business Bay, H1 2025
Business Bay’s strength lies in its scale and liquidity, but those very traits bring vulnerabilities that investors and end-users must weigh carefully.
- Oversupply risk: With nearly 70% of transactions off-plan and a heavy skew toward 1BR launches, saturation could pressure rents if absorption slows.
- Yield compression: Studios currently yield around 5%, but an unchecked flood of small units risks pulling this down, especially in the short-let segment.
- Lifestyle trade-offs: Density remains high. Large formats exist but are limited in both choice and community appeal, making Business Bay less compelling for families seeking open spaces or long-term stability.
- Service charges: Premium towers often carry elevated service fees, which can erode net yields for investors.
🧭 AIQYA Insight
Business Bay is a liquidity machine, not a lifestyle utopia. Its greatest risk is the very formula that makes it an attractive, compact, investor-driven stock at scale. For investors, vigilance is key: watch for signs of oversupply in 1BRs and monitor rental trends closely. For end-users, the question is less about affordability and more about suitability: is Business Bay a place to live, or a place to leverage centrality while waiting to upgrade? The corridor’s resilience depends on how well it balances churn with livability.
Supply Snapshot – What’s in the Pipeline?
Business Bay’s skyline remains a work in progress. The first half of 2025 not only saw heavy off-plan absorption but also laid the groundwork for a steady stream of new stock, most of it skewed toward compact formats.
- New launches dominated: Binghatti Skyrise and Bayz 102 collectively set the tone for H1, and their absorption figures show strong early demand.
- Pipeline depth: Multiple smaller towers are slated to hand over between 2026–2028, suggesting a consistent release of units into an already high-density corridor.
- Format bias: Most upcoming supply continues the compact theme, studios and 1BRs remain the developer’s template, with only marquee projects like Al Habtoor Tower anchoring the larger format segment.
- Delivery pressure: As handovers cluster, especially in 2026, secondary market pricing and rental yields could face short-term strain.
🧭 AIQYA Insight
The pipeline shows that Business Bay will remain launch-heavy for the foreseeable future. Developers are betting on the corridor’s investor appetite for compacts, but this raises a structural question: how much small-unit stock can the market absorb before yields compress? The key signal to track is not just sales velocity but how these projects lease once handed over. Business Bay’s long-term credibility rests on proving that its pipeline can transition smoothly from off-plan promise to ready-market performance.
Plot Transactions & Investment Signals – Business Bay, H1 2025
Despite its built-out skyline, Business Bay still saw 11 land deals in H1 2025, trading a combined 1.25 million sq.ft. of freehold plots. These were not raw desert parcels but large redevelopment sites, with median sizes of around 92,000 sq.ft. and deal values hovering near AED 210 million.
- Active recycling: Plots continue to change hands even in a mature corridor, signalling developers’ confidence in Business Bay’s long-term liquidity.
- High barriers to entry: Ticket sizes above AED 200M mean only institutional players or large private developers can participate.
- Pipeline indicator: Every land deal here points to a future tower, adding to the already heavy off-plan pipeline.
🧭 AIQYA Insight
Land transactions in Business Bay show that the district’s story is far from finished. Developers are betting big on repurposing sites for the next generation of compact towers. For investors, these land signals are forward-looking markers: the pipeline will stay dense, supply will keep coming, and liquidity will be tested again at handover. In short, Business Bay is not standing still; it is preparing for another cycle of vertical growth.
Final Observations & Buyer Takeaways – Business Bay, H1 2025
Business Bay’s first half of 2025 reaffirmed its place as Dubai’s liquidity corridor. With 3,721 transactions worth AED 8.3B, the district traded at scale while keeping prices steady at ~AED 2,372 per sq.ft. The off-plan market drove absorption, but the ready segment stayed relevant, ensuring depth across both channels.
For investors, the message is clear: Business Bay works best as a compact-unit play. Studios and one-beds dominate, offering entry around AED 1–1.8M with yields around 5%. The corridor’s churnability is unmatched, making it a reliable engine for yield-driven portfolios.
For end-users, the appeal lies in centrality and immediacy, not serenity. Larger homes exist but are niche, carrying thinner yields and higher service charges. Families seeking lifestyle ballast may find better fits in Downtown or emerging villa communities.
🧭 AIQYA Insight
Business Bay is Dubai’s reminder that real estate can be engineered around liquidity. It thrives on compact formats, developer launches, and investor churn. The risks, oversupply in 1BRs, density fatigue, and service charge erosion, are real, but so is the corridor’s resilience. For those seeking yield and quick entry into Dubai’s central grid, Business Bay remains one of the city’s most dependable bets.
Data Source Attribution
Figures are based on Dubai Land Department (DLD) registered transactions and lease contracts for H1 2025 (Jan–Jun). Scope covers Freehold Residential Flats and Villas.
Exclusions: Hotel Apartments, Hotel Rooms, and Commercial stock (offices, shops, retail) are not included in core metrics as they behave differently in both price and rental yield.
Methodology:
- Transactions filtered to include only Sale, Sell – Pre-registration, and Sale on Payment Plan.
- Deduplication applied using Unit + Project Name + Registration Date + Area.
- Medians calculated for price per sq.ft., unit size, and ticket size (conversion used: 1 sqm = 10.7639 sq.ft.).
- Gross yields are estimated as Median Annual Rent ÷ Median Sale Price.
- Plot transactions restricted to Residential Freehold parcels.
Minor gaps may exist due to naming inconsistencies or exclusions. This report is intended for insight and education, not financial advice.