
Dubai property price differences are often misunderstood, especially when similar homes appear to sell at very different prices.
- The Illusion of Comparability
- Off-Plan vs Ready: Where the Pricing Gap Begins
- Price Dispersion: How Wide the Same Home Can Stretch
- Project Positioning: Where Pricing Power Is Created
- Compact Units: Where Liquidity and Dispersion Meet
- What Buyers Get Wrong: Reading Price Without Context
- Takeaways
- Data Source Attribution
The Illusion of Comparability
A one-bedroom apartment should be a comparable product.
It has the same basic components.
A defined layout.
A similar range of sizes.
On the surface, it appears measurable.
That assumption breaks down quickly in Dubai.
Across the April 1–15 dataset, the same configuration studios, 1-bedroom, even 2-bedroom units is transacting across wide pricing bands that cannot be explained by size alone. Two apartments with nearly identical square footage can sit at entirely different price levels, even within the same broad micro-market.
This is not an edge case.
It is a recurring pattern.
The data shows that within the 1-bedroom category, price per square foot can vary by more than 150% between the lower and upper ends of the distribution. For 2-bedroom units, the spread is even wider. This is happening inside what most buyers would consider a single “comparable” category.
The implication is simple, but often overlooked:
In Dubai’s residential market, configuration does not create comparability.
What appears to be a standardised product is, in practice, shaped by a set of variables that sit outside the plan itself.
A 1-bedroom apartment is not just:
- a layout
- or a unit size
It is also:
- a project
- a launch moment
- a pricing strategy
- and a position within a larger development pipeline
These factors are not peripheral to the transaction. They define it. This is why pricing differences emerge not just across locations, but within the same category of homes.
The market is not pricing “types of apartments.”
It is pricing how those apartments are positioned.
🧭 AIQYA Insight
In most markets, comparability starts with the unit.
In Dubai, it starts with the project.
Off-Plan vs Ready: Where the Pricing Gap Begins
If configuration does not create comparability, the next layer to examine is timing.
Not when a buyer purchases,
but when the product enters the market.
Across the April 1–15 dataset, one of the clearest and most consistent patterns is the pricing gap between off-plan and ready inventory within the same area and configuration.
Where both segments have sufficient transaction volume, off-plan units are systematically priced above comparable ready stock.
The difference is material.
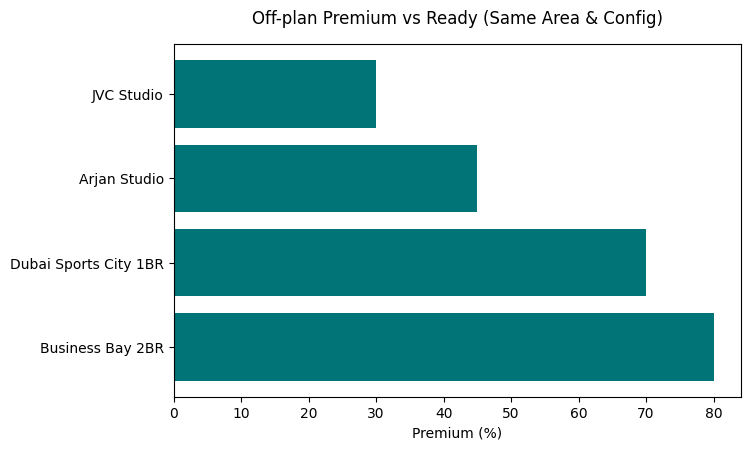
In several active areas:
- In Business Bay, 2-bedroom off-plan units are transacting at nearly 80% higher price per square foot than ready units
- In Dubai Sports City, 1-bedroom off-plan units show a premium of over 70%
- In Arjan, even studios typically the most price-sensitive category carry a premium of around 45%
- In Jumeirah Village Circle, studio pricing shows a gap of more than 30%
These are not isolated cases.
They form a consistent pattern across multiple micro-markets.
Why This Happens
This gap is not simply about new versus old.
It is about how pricing is constructed.
Off-plan inventory enters the market through:
- launch pricing, rather than continuous market discovery
- structured payment plans, which reduce immediate capital outflow
- forward positioning, where value is anchored to future delivery rather than present condition
Ready inventory, by contrast, is priced against:
- existing stock
- comparable transactions
- immediate usability
In other words:
off-plan pricing is set by expectation
ready pricing is shaped by comparison
The Role of Payment Structure
One of the most underestimated drivers of this gap is not price itself, but how the price is paid.
Staggered payment plans allow buyers to:
- commit with lower upfront capital
- spread risk over construction timelines
- enter projects that might otherwise sit outside immediate affordability
This changes how pricing is perceived.
A higher nominal price does not always feel like a higher cost if it is distributed over time.
As a result, off-plan inventory can sustain pricing levels that would be harder to achieve in a ready-market transaction requiring full capital deployment.
What This Means for Comparability
This is where the illusion of comparability breaks down further.
A 1-bedroom apartment in the same area is not just:
- two similar units
It is often:
- one priced through forward positioning and structured payments
- another priced through immediate market comparison
These are fundamentally different pricing systems.
Comparing them directly on price per square foot can lead to misleading conclusions about value.
📝 Interpretation
The April dataset shows that off-plan inventory is not merely competing with ready stock. It is operating within a different pricing framework altogether, one that allows it to command consistent premiums across configurations and locations.
This is one of the primary reasons why similar homes appear to be priced so differently within the same market.
🧭 AIQYA Insight
The pricing gap between off-plan and ready is not an anomaly.
It is structural.
As long as:
- payment plans remain central
- launch cycles continue to drive supply
- and buyers engage through forward commitment
off-plan pricing will not mirror the ready market.
It will run on a different logic.
The same home can sit across entirely different pricing systems.
Price Dispersion: How Wide the Same Home Can Stretch
If off-plan explains why pricing begins to diverge, dispersion shows how far that divergence can go.
Across the April 1–15 dataset, the spread in price per square foot within the same configuration is not narrow. It is substantial.
And it increases as we move up the configuration ladder.
The Spread Within Each Configuration
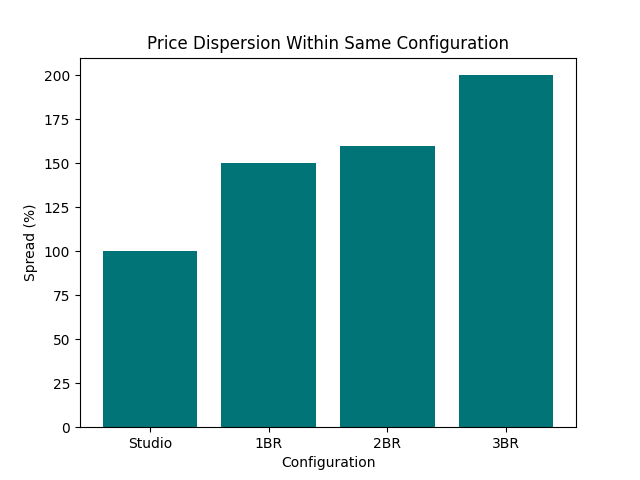
Using distribution ranges within each category:
- Studios show a price spread of nearly 100% between the lower and upper ends
- 1-bedroom units extend to a spread of approximately 150%
- 2-bedroom units widen further to over 160%
- 3-bedroom units move beyond 200%, with even higher variation in limited-volume segments
These are not fringe outliers.
They represent the range within which a significant portion of transactions are occurring.
What This Means in Practice
Take a 1-bedroom apartment.
At one end of the distribution, it may transact at a relatively modest price per square foot, aligned with mid-market positioning.
At the other end, a similar-sized unit often in a different project within the same broader market can command a price that is more than double.
The layout has not changed.
The number of rooms has not changed.
Even the size may not differ meaningfully.
What changes is everything around it.
Size Is Not the Primary Driver
One of the most common assumptions is that price variation is explained by size.
The dataset does not support that.
Within compact categories:
- smaller units often command higher price per square foot
- larger units within the same configuration can transact at lower psf
This weak or even inverse relationship between size and pricing indicates that:
price is not being determined by space alone
Instead, it reflects:
- project positioning
- brand perception
- micro-location advantages
- and launch context
Where the Spread Becomes Most Visible
The dispersion is most pronounced in the segments that carry the most liquidity:
- studios
- 1-bedroom units
These are the categories where:
- transaction volume is highest
- project pipelines are most active
- and buyer participation is most diverse
In other words, the market’s most traded segments are also its most fragmented in pricing.
A Market of Ranges, Not Points
What this creates is a different way of reading the market.
Instead of:
- a single “market price” for a 1-bedroom apartment
there exists:
- a range of prices, shaped by project-level factors
This is why median pricing alone can be misleading.
It tells us where the centre lies,
but not how wide the field has become.
📝 Interpretation
April’s dataset shows that price variation within the same configuration is not marginal. It is a defining characteristic of the market.
The same home type can occupy significantly different pricing positions, even when size and location are broadly comparable.
🧭 AIQYA Insight
Dispersion is not noise.
It is structure.
Dubai’s residential market is not organised around fixed price points for each configuration. It operates within bands of value, where the spread itself reflects differences in positioning, timing, and perception.
The wider the spread, the more important it becomes to understand what is driving it.
Project Positioning: Where Pricing Power Is Created
If two similar homes can transact at very different price levels, the explanation does not lie within the unit.
It lies in the project that carries it.
Across the April dataset, pricing differences within the same configuration are consistently linked to project-level positioning rather than to physical attributes of the apartment itself.
This is where Dubai’s residential market diverges from more uniform systems.
The Project as the Primary Unit of Value
In many markets, value is anchored at the unit level.
In Dubai, value is anchored at the project level.
A 1-bedroom apartment is not priced in isolation.
It is priced as part of:
- a branded development
- a specific launch cycle
- a defined micro-location
- and a curated narrative around future value
This shifts the centre of gravity.
The unit carries the transaction.
The project carries the price.
How Positioning Translates into Price
The dataset shows that similar configurations are being priced differently based on a combination of factors that sit outside the floor plan:
1. Developer Identity
Developers with:
- consistent delivery history
- strong brand recall
- and established market presence
are able to command higher price per square foot, even within comparable locations.
2. Launch Timing
Projects entering the market during:
- strong demand windows
- or with limited competing supply
often set pricing benchmarks that later transactions align with.
This creates step changes in pricing that are not directly tied to physical differences in the product.
3. Payment Structure
Flexible payment plans:
- reduce upfront commitment
- expand the buyer pool
- and soften price sensitivity
This allows projects to sustain higher headline pricing without immediately encountering resistance.
4. Micro-Location Within the Same Area
Even within the same broad micro-market, positioning varies:
- proximity to key infrastructure
- internal community planning
- future development potential
These differences are often subtle, but they are reflected in pricing spreads.
5. Narrative and Presentation
Projects are not just sold as units.
They are presented as:
- lifestyle propositions
- investment opportunities
- or part of a larger master plan
This narrative layer influences buyer perception, which in turn influences pricing tolerance.
From Product to Proposition
What emerges from this is a shift in how the market functions.
Apartments are no longer competing purely as physical products.
They are competing as propositions.
Two units may be identical in size and configuration, but if they belong to projects with different positioning, they do not compete on the same terms.
Why This Matters More in Off-Plan
This effect is amplified in off-plan inventory.
Because pricing is set at launch:
- there is limited immediate comparison
- fewer transaction benchmarks exist
- and perception plays a larger role
This allows project positioning to shape pricing more strongly than in the ready market, where comparables are more visible and immediate.
📝 Interpretation
The April dataset shows that pricing variation within the same configuration is closely tied to project-level factors. Differences in developer identity, launch timing, payment structures, and micro-location are translating directly into measurable pricing spreads.
🧭 AIQYA Insight
In Dubai, configuration defines category.
Project defines value.
Understanding this distinction is essential.
Without it, pricing differences appear arbitrary.
With it, they become structured and explainable.
Compact Units: Where Liquidity and Dispersion Meet
The strongest overlap between transaction activity and pricing variation sits in the same place:
compact homes.
Studios and 1-bedroom apartments account for the majority of transactions in the April dataset. They form the market’s primary entry point, both in terms of affordability and investor participation.
But they also show the widest pricing dispersion within the same configuration.
The Core of the Market
Compact units dominate because they align with all three drivers of demand:
- entry affordability → lower ticket sizes
- rental viability → stronger yield expectations
- transaction flexibility → easier to enter and exit
This combination positions them as the market’s liquidity engine.
It is where volume concentrates.
Where the Spread Becomes Most Visible
At the same time, these units exhibit the most pronounced pricing variation.
Across the dataset:
- studio units span nearly 100% price difference between lower and upper ranges
- 1-bedroom units extend to approximately 150% variation
This means that within the most actively traded segment, the same category of home can sit across vastly different pricing bands.
Why Compact Units Show the Largest Variation
There are three reasons this segment amplifies dispersion:
1. High Volume, High Diversity
With the largest number of transactions:
- more projects are competing
- more pricing strategies are visible
- and more positioning differences emerge
2. Investor Sensitivity to Structure, Not Just Price
Buyers in this segment are not evaluating:
- absolute price alone
They are evaluating:
- payment structure
- expected rental performance
- future resale positioning
This allows projects with different positioning to sustain different pricing levels within the same configuration.
3. Off-Plan Concentration
Compact units are heavily represented in off-plan launches.
As a result:
- pricing is often set at launch
- comparison with ready stock is less immediate
- and perception plays a larger role
This reinforces the pricing gap identified earlier.
Liquidity Does Not Mean Uniformity
There is a tendency to assume that high-volume segments behave in a uniform way.
The data shows the opposite.
The segment that trades the most is also the one where:
- pricing varies the most
- project positioning matters the most
- and buyer interpretation plays the largest role
A Market That Sorts Within Itself
What emerges is not a fragmented system, but a self-sorting one.
Within compact units:
- lower-band projects absorb entry-level demand
- mid-band projects capture balanced investor participation
- higher-band projects position themselves around brand, location, or future potential
All within the same configuration.
📝 Interpretation
The April dataset shows that compact units are not just the most active segment of the market. They are also the most internally varied, with pricing spreads that reflect differences in positioning rather than differences in the physical product.
🧭 AIQYA Insight
Liquidity does not create uniform pricing.
It creates layers within the same category.
In Dubai’s residential market, the segments that move the fastest are also the ones where buyers must interpret value the most carefully.
Configuration defines the category. Project defines the value.
What Buyers Get Wrong: Reading Price Without Context
If pricing differences across similar homes are structural, the risk is not that the market is inconsistent.
The risk lies in how it is interpreted. Across the April dataset, the same configuration spans wide pricing ranges. But much of that variation is often interpreted through a simplified lens, one that assumes comparability where it does not exist.
This is where most misjudgements begin.
1. Treating Price per Square Foot as a Universal Benchmark
Price per square foot is often used as the primary basis for comparison.
It works well in markets where:
- products are standardised
- and transactions are comparable
In Dubai, that assumption breaks down.
When two units belong to different projects:
- they are not priced within the same system
- they are not influenced by the same launch conditions
- and they do not carry the same positioning
As a result:
the same psf number can represent very different underlying value
2. Comparing Off-Plan and Ready as Like-for-Like
A common comparison is:
- off-plan psf vs ready psf
- or off-plan ticket vs ready ticket
The dataset shows that off-plan often carries a pricing premium.
But this premium is not just a function of “new versus old.”
It reflects:
- forward pricing
- payment flexibility
- and expectation of future value
Comparing these directly without adjusting for those factors can create a misleading sense of overpricing or undervaluation.
3. Assuming Configuration Defines Value
A 1-bedroom apartment is often treated as a single category.
The data shows otherwise.
Within the same configuration:
- pricing can vary significantly
- positioning differs widely
- and buyer intent is not uniform
configuration defines the category, but it does not define the value within it
4. Ignoring Project-Level Context
The most consistent driver of pricing variation in the dataset is the project itself.
Yet this is often underweighted in comparison.
Buyers may focus on:
- area
- size
- and price
while overlooking:
- developer track record
- launch phase
- and positioning within the broader pipeline
This creates a gap between:
- observed price
- and underlying context
5. Reading the Market Through Averages
Median pricing provides a useful reference point.
But it compresses variation.
In a market where dispersion is wide:
- the median does not represent the typical transaction
- it represents the centre of a broad range
Without understanding that range, it is easy to misplace where a specific project sits within the market.
From Data to Interpretation
None of these are errors in the data.
They are errors in interpretation.
The dataset is consistent.
What varies is how it is read.
📝 Interpretation
The April dataset shows that pricing differences across similar homes are not arbitrary. They reflect structured differences in project positioning, timing, and pricing frameworks. Misreading these differences often leads to incorrect comparisons and conclusions about value.
🧭 AIQYA Insight
In a market defined by variation, clarity does not come from simplifying the data.
It comes from understanding the layers within it.
The more structured the variation, the more important it becomes to read beyond surface comparisons.
The difference between two similar homes is not the home. It is the system within which it is priced.
Takeaways
The April dataset does not point to a fragmented market.
It reveals a layered one.
At first glance, pricing differences across similar homes appear inconsistent.
A 1-bedroom apartment priced at one level sits alongside another of similar size at a very different level.
But when viewed through the lens of:
- off-plan versus ready pricing
- project-level positioning
- and configuration-level dispersion
those differences begin to align.
They are not random.
They are structured.
A Market Built on Multiple Pricing Systems
One of the clearest outcomes of this analysis is that Dubai’s residential market does not operate on a single pricing framework.
It operates on overlapping systems:
- Off-plan pricing, anchored in future positioning and payment structure
- Ready market pricing, shaped by comparables and immediate usability
- Project-level pricing, influenced by brand, timing, and narrative
Each of these systems produces its own price range.
When they intersect within the same configuration, they create the wide dispersion observed in the dataset.
Why Similar Homes Are Not Comparable
The idea of comparability rests on the assumption that similar products are priced within the same system.
That assumption does not hold here.
A 1-bedroom apartment is not a uniform product across the market.
It is a category within which multiple pricing logics operate simultaneously.
This is why:
- size alone does not explain price
- configuration alone does not define value
- and price per square foot alone does not provide clarity
From Uniformity to Interpretation
What this creates is a shift in how the market needs to be read.
In more standardised systems:
- value is derived from comparison
In Dubai:
- value is derived from interpretation of context
The same number can carry different meanings depending on:
- where it sits within the pricing range
- which project it belongs to
- and how it has been brought to market
What This Means Going Forward
This is not a temporary condition.
As long as:
- off-plan continues to dominate transactions
- launch cycles shape supply
- and project positioning remains central
pricing variation will remain a defining feature of the market.
The question is not whether similar homes will converge in price.
It is whether buyers can correctly identify:
- what they are paying for
- and which pricing system they are entering
📝 Interpretation
The April dataset shows that pricing differences across similar homes are a structural outcome of how the market operates. These differences are driven by multiple pricing systems and project-level positioning, rather than inconsistencies in the product itself.
🧭 AIQYA Insight
In Dubai, similarity in form does not guarantee similarity in value.
Understanding the market requires moving beyond comparison and toward context.
Closing Line
The difference between two similar homes is not always the home itself.
It is the system within which it is priced.
Data Source Attribution
Dubai Land Department (DLD) – Registered Transactions
Period: April 1–15, 2026
Scope: Residential, Freehold, Unit, Flat transactions
Methodology:
- Median price per sq.ft = TRANS_VALUE / (ACTUAL_AREA × 10.7639)
- Off-plan vs Ready from source field
- Deduplication: Unit + Project + Registration Date + Area
- Comparative analysis conducted within same area and configuration pairs
Disclaimer
Figures are based on official registered datasets. Minor gaps may exist due to naming inconsistencies or exclusions. This article is intended for insight and education, not financial advice.
You may also like:
Dubai Real Estate Market April 2026: Liquidity Narrows as Off-Plan Dominance Deepens
Dubai Housing Corridors: Where Growth Is Concentrating – Q1 2026 Analysis
Dubai Property Market Q1 2026: Structure, Pricing and Demand Trends