
Dubai property market March 2026 presents a moment worth isolating. Activity slows under the combined effect of geopolitical tension across West Asia and weather disruption within the city. Yet beneath this moderation, pricing, buyer behaviour, and market structure remain largely unchanged, offering a clearer reading of how the system responds under pressure.
Volume slowed. Structure did not.
When External Events Meet Market Structure
March 2026 does not sit in isolation.
It unfolds against two overlapping conditions – a period of heightened geopolitical tension across West Asia and a phase of weather disruption within Dubai itself. Both are external to the property market, yet both have the ability to influence it in the short term.
Geopolitical uncertainty tends to affect sentiment first. It introduces hesitation, delays decision-making, and can slow cross-border capital flows, even if temporarily. At the same time, the weather disruption is more immediate in its effect. Heavy rainfall and flooding do not change demand, but they interfere with the mechanics of the market site visits, registrations, and day-to-day transaction movement.
These are not structural shifts.
They are interruptions to the flow.
The distinction matters.
Markets that are built on momentum tend to react sharply to such interruptions. Activity slows, pricing softens, and behaviour shifts toward caution. Markets that are built on structure tend to behave differently. They absorb the disruption first through timing, before anything else begins to adjust.
March offers a moment to observe which of these conditions applies.
The question is not whether the activity slowed.
It is whether anything beneath it changed.
And that is what makes this month worth isolating.
Transaction Reality
Where the Slowdown Actually Occurs
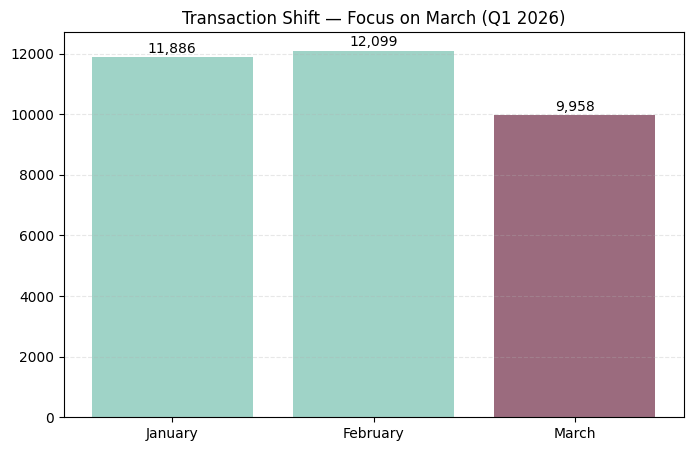
The first visible effect of March appears in transaction volume.
Across Q1, activity builds through January and February before moderating in March.
| Month | Transactions |
| January | 11,886 |
| February | 12,099 |
| March | 9,958 |
The decline from February to March is approximately 17–18%, making March the softest month of the quarter.
The movement, however, is not abrupt. January establishes a stable base, February edges higher, and March steps back. The progression reads as a slowdown in execution rather than a break in demand.
The quarter as a whole remains intact at 33,943 transactions, indicating that activity has not disappeared, but shifted in pace.
March does not disrupt the quarter’s structure.
It compresses it.
Price Behaviour
Stability Without Support – When Volume Softens but Pricing Holds
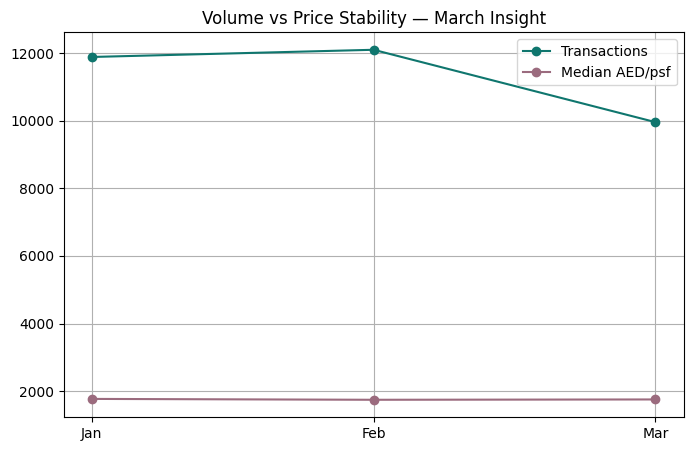
If transaction volume reflects how quickly the market is moving, pricing reflects how firmly it is anchored.
In March, the expected sequence would be straightforward. A decline in transactions would typically begin to show up in pricing, especially if demand is weakening. That relationship does not appear here.
Across the quarter, pricing remains within a narrow band.
| Month | Median AED/psf | Median Ticket (AED) |
| January | 1,768.93 | 1,381,800 |
| February | 1,743.29 | 1,392,000 |
| March | 1,752.99 | 1,390,000 |
Pricing softens slightly in February before firming again in March, even as transaction volumes decline.
There is no visible correction in response to the drop in transactions.
This distinction matters.
When markets come under pressure, price typically adjusts before volume stabilises. Here, the adjustment happens in reverse. Volume slows, but pricing remains steady, indicating that there is no urgency to discount or clear inventory.
Part of this stability comes from composition. A significant share of transactions continues to sit within off-plan projects, where pricing is influenced by launch positioning rather than immediate resale dynamics. As long as this segment dominates, overall median pricing tends to remain firm.
At the same time, ticket sizes remain anchored within the same affordability band. There is no visible expansion into higher-value transactions, but there is also no contraction toward lower bands. The centre of the market holds.
Pricing, in this context, is not reacting to short-term movement.
It is following the structure already in place.
Primary vs Secondary Shift
No Defensive Rotation
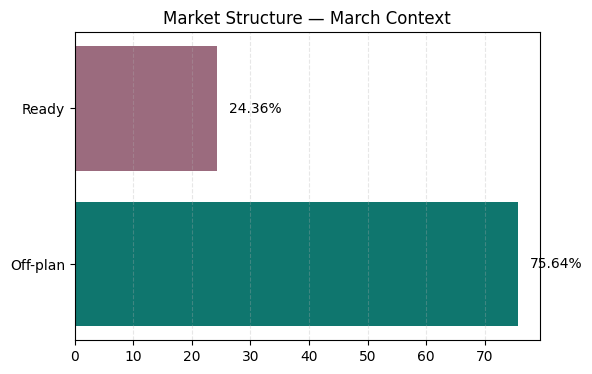
If March introduced uncertainty into the market, the first place it would typically appear is in the shift between off-plan and ready transactions.
In periods of hesitation, buyers tend to move toward certainty, completed homes, immediate usability, and known outcomes. That shift is not visible here.
The market composition remains largely unchanged.
| Segment | Share |
| Off-plan | 75.64% |
| Ready | 24.36% |
Even as transaction volumes ease in March, off-plan continues to dominate at the same scale. There is no meaningful movement toward ready inventory.
This absence of rotation is significant.
It suggests that buyers are not responding defensively to external conditions. They are not stepping back into completed assets. They are continuing to engage with projects under construction, committing to delivery timelines and structured payment plans.
The difference between the two segments reinforces this behaviour.
Off-plan transactions are built around staged entry. They allow buyers to participate without deploying full capital immediately, which reduces short-term sensitivity to disruption. Ready transactions, by contrast, require immediate commitment and are more closely tied to current market conditions.
In March, the market does not move toward immediacy.
It remains positioned toward the future.
This continuity indicates that the slowdown in transactions is not being driven by a loss of confidence. It reflects a pause in execution rather than a shift in preference.
The structure holds.
Configuration Behaviour
Liquidity Remains Concentrated
If there were a shift in demand beneath the surface, it would begin to appear in configuration.
In periods of uncertainty, markets often show subtle changes here. Buyers either move toward smaller, lower-commitment units or step back from participation altogether. Neither pattern is clearly visible in March.
The configuration mix remains broadly consistent with the quarter.
| Configuration | Share |
| 1BR | 42.38% |
| Studio | 24.71% |
| 2BR | 25.87% |
| 3BR | 6.25% |
| 3BR+ | 0.77% |
Studios and 1BR units continue to account for nearly two-thirds of all transactions. These formats remain the most active, the most repeatable, and the easiest to absorb.
There is no visible shift toward smaller units as a defensive response.
There is also no expansion into larger configurations.
The centre holds.
This consistency is important because it reinforces where the market’s liquidity actually sits. Compact units are not just a dominant category. They are the segment through which the market continues to function, even when overall activity slows.
The 2BR segment maintains its position as the transition layer. It carries a steady share, reflecting a mix of investor and end-user participation. Larger configurations remain limited in volume, unchanged in their selective nature.
What March shows is not a change in preference, but a continuation of it.
The slowdown in transactions does not alter what buyers are choosing.
It only affects how quickly those choices are being executed.
Rental Check
Income Remains Aligned
If sales activity slows under external pressure, the rental market becomes the next layer to observe. It reflects whether the system continues to be supported by actual usage rather than transaction momentum.
In March, rental activity follows a similar pattern to sales, but at a different scale.
| Month | Contracts |
| January | 58,744 |
| February | 51,638 |
| March | 39,041 |
The decline into March is visible, but it mirrors the broader quarterly rhythm rather than signalling a break in demand. Leasing activity remains significantly higher than sales, reinforcing that the market continues to operate as an occupied system.
At an aggregate level, the numbers remain stable.
| Metric | Q1 2026 |
| Rental contracts | 149,423 |
| Median annual rent | AED 64,000 |
| Implied gross yield | ~4.6% |
The median rent continues to align with the same affordability band that dominates transactions. This consistency matters. It indicates that pricing in the sales market is not detached from the rental base.
The yield range, while moderate, remains workable. It does not point to excess return, but it provides enough support for investor participation without relying solely on capital appreciation.
The structure within rentals also remains unchanged. Studios and 1BR units continue to form the core of leasing activity, mirroring their role in the sales market. These formats remain the easiest to lease and the most consistently occupied.
What emerges is a system that is still supported from below.
Rental demand does not weaken in a way that would pressure pricing.
It continues to provide a stable income layer beneath the transaction market.
Even as activity moderates, the underlying usage remains intact.
Interpretation
What March Actually Reveals
March does not introduce a new trend. It reveals how the existing structure behaves when it is interrupted.
The visible change is in volume. Transactions slow, and activity eases from the levels seen in February. But beyond that first layer, the system remains largely unchanged.
Pricing does not correct.
Buyer behaviour does not rotate.
Configuration demand does not shift.
Rental support does not weaken.
Each layer holds its position.
This combination is important because it separates interruption from instability.
The slowdown is real, but it is contained within execution rather than sentiment. Buyers are not stepping away from the market. They are moving through it more slowly. Transactions are delayed, not withdrawn.
The market did not react. It absorbed.
The dominance of off-plan continues to play a central role in this behaviour. Structured payment plans reduce immediate capital pressure, allowing buyers to absorb short-term disruptions without needing to exit or renegotiate. This creates resilience, particularly in periods where external conditions affect timing more than intent.
At the same time, the concentration of demand in compact units provides a stable base. Studios and 1BRs continue to transact because they remain within accessible price bands and align closely with rental demand. This keeps liquidity intact even when overall activity softens.
The rental layer reinforces this stability. With a large base of leasing activity and yields remaining within a workable range, pricing is not forced to adjust downward to attract demand.
What emerges is a market that does not react immediately to short-term pressure.
It absorbs it.
March, in that sense, functions less as a turning point and more as a test. It introduces friction into the system and allows us to observe where that friction is absorbed.
In this case, it is absorbed first through timing, not through price or behaviour.
That distinction defines the month.
Given the combination of geopolitical uncertainty and local disruption, a sharper contraction could have been expected. The fact that activity moderated without deeper structural change reinforces that the slowdown remains contained.
Final Signal
A Market That Adjusts Without Breaking
March does not signal a shift in direction. It clarifies the nature of the system.
Activity slows, but not unevenly. Pricing holds without needing support. Buyers continue to engage in the same segments, through the same structures, without visible hesitation. The market absorbs external pressure without forcing a visible adjustment beneath it.
This is not a sign of acceleration.
It is a sign of stability under interruption.
The key takeaway from the month is not the decline in transactions. It is the absence of any secondary effects that typically follow such a decline.
There is no price correction.
No movement toward safer assets.
No shift away from compact units.
Each of these would have suggested a deeper change in sentiment. Their absence suggests that the slowdown remains contained within execution.
The structure that supports the market continues to hold:
- off-plan transactions remain dominant
- compact units continue to carry liquidity
- rental demand continues to anchor pricing
This alignment allows the market to adjust in pace without needing to adjust in value.
March, therefore, is not a weak month.
It is a revealing one.
It shows that the market is not dependent on uninterrupted momentum. It can absorb disruption without immediately translating it into structural change.
That is the signal.
Data Source Attribution
This note is based on officially registered transaction records from the Dubai Land Department, along with registered rental contract data used to read the income layer of the market.
Scope
- Geography: Dubai
- Period covered: March 2026 (with Q1 context for comparison)
- Core sales scope: Residential, Freehold, Unit, Flat transactions
- Core rental scope: Residential, Freehold, Unit, Flat and Studio rental contracts
Sales procedures included
- Sale
- Sell – Pre registration
- Sale on Payment Plan
Excluded from core apartment sales scope
- Villas
- Townhouses
- Plots / land
- Hotel apartments
- Commercial assets
- Mortgages, grants, delayed sell, lease-to-own, and other non-sale procedures
Price metric
AED per square foot is calculated as:
TRANS_VALUE / (ACTUAL_AREA × 10.7639)
Deduplication
- Sales: Transaction-level cleaning applied using
Unit + Project Name + Registration Date + Area - Rentals: Deduplication applied using
Project + Registration Date + Annual Amount + Area
Notes
- Off-plan versus ready segmentation is taken directly from the source field, with no manual overrides
- Rental yields are indicative gross yields derived from median annual rent against median sale ticket
- Studios are included within rental analysis to avoid undercounting compact demand
- Minor gaps may exist where project names are missing or inconsistently tagged, particularly within parts of the ready dataset
Disclaimer
Figures are based on official registered datasets. Minor gaps may exist due to naming inconsistencies, missing fields, or classification limitations in the source export. This note is intended for insight and education, not financial advice.