Dubai property market trends 2026 show that April’s rise in activity reflects off-plan absorption and pricing mix, rather than a structural shift in demand.
Market Overview
April drew attention to Dubai’s property market.
Transaction volumes recovered from the March slowdown, pricing moved upward, and off-plan activity strengthened. At a surface level, this reads as continued momentum.
But when placed against Q1, the movement appears more contained.
The quarter had already established a clear structure. Transactions were active, pricing was stable, and demand was concentrated within a defined band. April does not break from that structure. It operates within it.
The distinction is important.
Short-term movement can appear directional. Structural change is slower, and more difficult to displace.
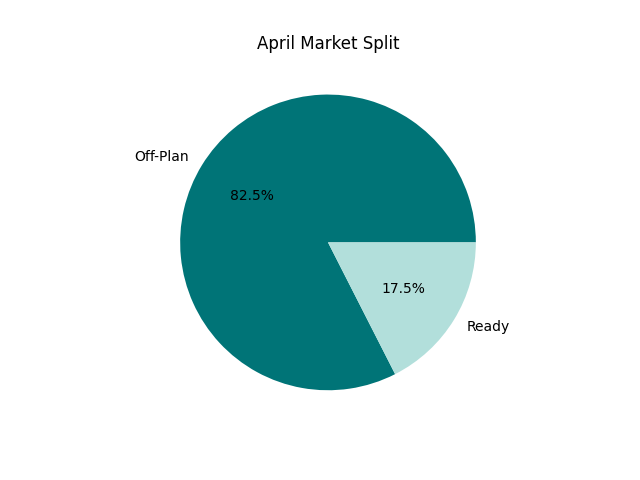
April Market Split
Key Market Metrics
Q1 vs April — Core Indicators
| Metric | Q1 2026 | April 2026 | Change |
| Transactions | 33,943 | 10,677 | Recovery vs March |
| Median Price (AED/sqft) | 1,754.87 | 1,865.38 | ↑ ~6.3% |
| Median Ticket (AED) | 1,389,000 | 1,522,000 | ↑ ~9.5% |
| Off-Plan Share | 75.64% | 82.5% | ↑ |
| Ready Share | 24.36% | 17.5% | ↓ |
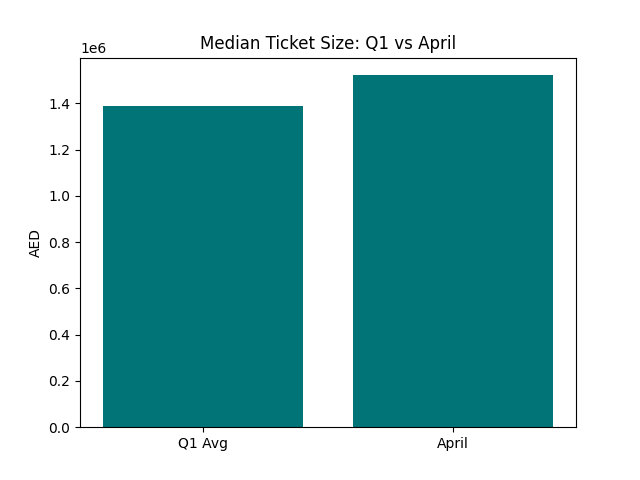
Media Ticket Size: Q1 vs April
What Changed
April does register movement across key indicators.
The most visible shift is in off-plan participation.
The share of off-plan transactions rises from 75.64% in Q1 to 82.5% in April. This is not a marginal change. It indicates that the increase in activity is concentrated within new supply rather than resale inventory.
Pricing also moves upward.
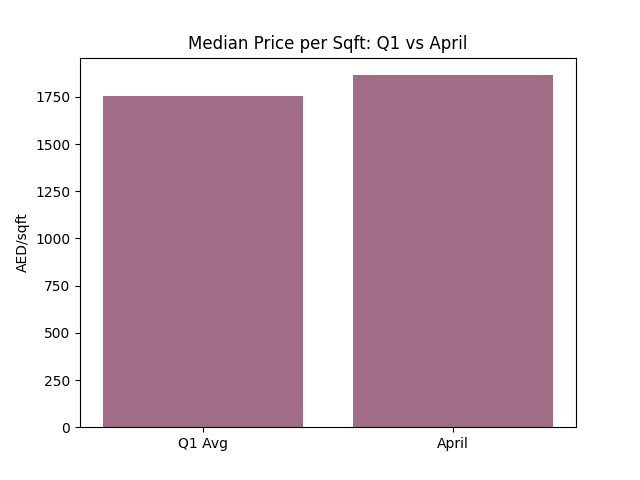
Media Price per Sqft. Q1 vs April
Median price per square foot increases by approximately 6%, while median ticket size rises by close to 10%. This suggests that the transactions contributing to April’s activity are occurring at higher price points than the Q1 median.
This reflects either a shift toward higher-priced inventory or a greater share of newer project transactions.
However, the direction of this movement matters.
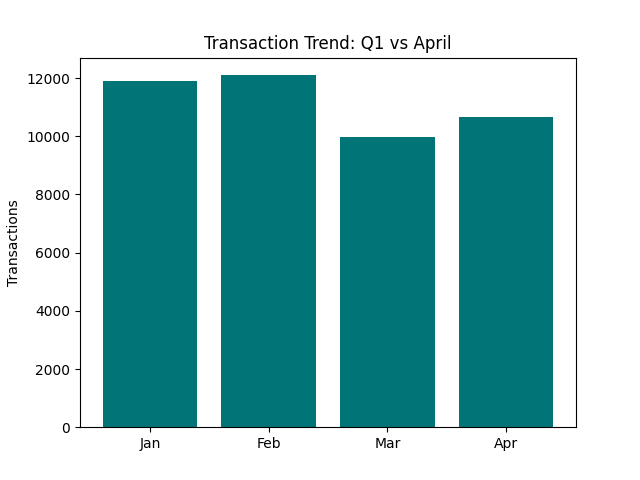
Transaction Trend: Q1 vs April
The increase aligns with the higher share of off-plan transactions, where pricing typically sits above the market median. This points to a composition effect, rather than a uniform repricing across the market.
Transaction volumes also recover.
After March records 9,958 transactions, April rises to 10,677. The increase is visible, but not disproportionate when viewed against January and February levels. This suggests that March represented a pause rather than a break in demand.
Taken together, April shows:
- Increased off-plan absorption
- Higher median pricing driven by mix
- Recovery in transaction velocity
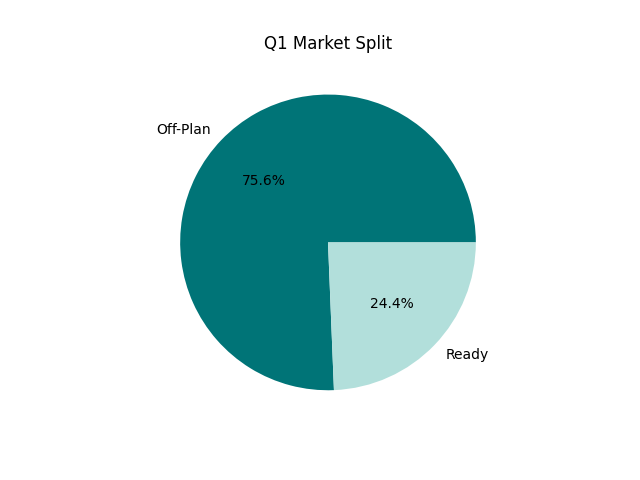
Q1 Market Split
What Didn’t Change
Despite these movements, the underlying structure remains intact.
Pricing behaviour remains controlled.
Even with the April increase, pricing continues to operate within a defined band. There is no evidence of broad-based acceleration across segments.
Demand concentration is unchanged.
Q1 establishes the market’s centre within the AED 1M–2M range. April does not show a meaningful expansion beyond this band at scale. Buyers continue to transact within the same affordability envelope.
Configuration mix remains consistent.
Studios and 1BR units continue to dominate transaction activity. The formats that drive liquidity in Q1 remain the same in April.
The market remains off-plan led.
The increase in off-plan share reinforces the existing structure rather than altering it. Buyers continue to enter through staged commitments rather than shifting toward immediate ownership.
In effect, the system that defines Q1 continues to operate without disruption.
Where the Signal Actually Lies
If April does not change the structure, where should the signal be read?
Not in volume alone.
The increase in transactions aligns with continued absorption of new supply. This is consistent with how Dubai’s property market operates, where activity is often influenced by the timing of project releases rather than a uniform shift in demand.
The rise in off-plan share supports this reading.
Higher activity is not coming from increased resale participation or distress-led transactions. It is coming from buyers entering through structured payment plans tied to new inventory.
The corresponding decline in ready-market share reinforces this, indicating that the increase in activity is not being driven by resale supply.
This distinction matters.
It separates:
- demand expansion, from
- timing-driven activation of existing demand
April reflects the latter.
Final Observations
April introduces movement, but not change.
Activity recovers, pricing shifts upward at the margin, and off-plan participation increases. These are measurable developments, but they do not alter the underlying structure established in Q1.
The market continues to be defined by:
- Concentrated demand within a mid-market band
- Dominance of compact, liquid configurations
- Strong dependence on off-plan supply
What changes is visibility.
The increase in activity draws attention, but the mechanics remain consistent.
Q1 provides the baseline.
April operates within it.
The difference between the two is not structural.
It is incremental.
Continue Your Research:
Dubai Residential Market – April 2026 (Apartments)
Dubai Villa Market April 2026 – Stability Beneath the Surface