
Dubai real estate market March 2026 presents a picture of balance rather than momentum.
Across 4,499 apartment transactions recorded in the first half of the month, the data points to a market that is recalibrating – not slowing down. Demand remains active, but increasingly selective, with clear patterns emerging across price bands, configurations, and end-user preferences.
- Dubai Market Pulse
- Key Market Metrics
- Price Trends & Market Interpretation
- Primary vs Secondary Market Composition
- Configuration Distribution – What Are Buyers Choosing?
- Unit Size Trends & Market Signals
- A Note on Villas in the Residential Market
- Top Projects & Developer Activity
- Affordability Snapshot – Where Buyers Are Spending
- Buyer Profile & Demand Lens
- Rental Trends & Yield Outlook
- Configuration Spotlight – Project-wise Breakdown
- Risks & Watchpoints
- Supply Snapshot – What’s in the Pipeline
- Final Observations & Buyer Takeaways
Key Highlights
- 4,499 apartment transactions recorded in the first half of March 2026, indicating sustained market activity
- Off-plan (55%) continues to lead, while ready inventory (45%) provides stability and immediate occupancy options
- AED 1M–2M segment remains the market’s core, driving the highest transaction volumes
- Studios and 1BR units dominate demand, reinforcing affordability-led buying patterns
- Larger units (3BR+) show selective absorption, reflecting lifestyle-driven purchases rather than volume demand
- Rental yields range between ~3% to 6%, with smaller units offering stronger returns
- Price trends remain stable across key segments, with no signs of sharp correction or overheating
Buyer behaviour shows increasing selectivity, with a clear preference for value, usability, and location
Dubai Market Pulse
Residential Freehold Apartment Transactions 1 – 15 March 2026
Dubai’s residential property market entered March against a backdrop of global financial volatility. Equity markets across several regions experienced sharp movements, raising questions about whether investor sentiment in real estate might briefly pause.
Yet transaction data from the Dubai Land Department suggests that the city’s housing market has continued to function with notable liquidity. During the first fifteen days of March, thousands of residential apartment transactions were recorded across the freehold market, reflecting sustained buyer activity despite external uncertainty.
Short-cycle transaction windows often provide the earliest signals of changing market behaviour. While prices tend to adjust slowly, shifts in transaction composition, such as the balance between off-plan and ready properties or the types of units being traded, can reveal how buyers are responding to broader economic signals.
Early March data indicates that compact apartments continue to dominate market activity, reinforcing a pattern that has defined Dubai’s residential market in recent years. Smaller units remain the primary entry point for investor capital, while larger family homes form a quieter but stable layer of end-user demand.
Rather than showing signs of abrupt hesitation, the transaction data suggests a market that continues to absorb liquidity across multiple price segments. For investors and end-users alike, Dubai’s residential market appears to be operating with the same structural rhythm that has characterised the post-pandemic property cycle.
Key Market Metrics
March 1 – 15, 2026 | Freehold Residential Apartments
| Metric | Value |
| Total Transactions | 4,499 |
| Off-Plan Share | ~55% |
| Ready Share | ~45% |
| Median Ticket Size | ~AED 1.25M – 1.30M |
| Median Price | ~AED 1,500 – 1,550 / sq ft |
| Median Unit Size | ~75 – 85 sqm |
Interpretation
The first half of March reflects a market that continues to operate with stable transactional depth. With nearly 4,500 residential apartment deals recorded in just 15 days, activity levels remain consistent with Dubai’s recent run-rate.
The off-plan segment retains a slight lead, accounting for more than half of total transactions. This suggests that developer-led inventory continues to absorb investor demand, even in the face of broader financial uncertainty.
Median ticket sizes remain firmly within the AED 1M–2M band, reinforcing the role of mid-market apartments as the primary driver of liquidity. At the same time, the median unit size indicates a continued preference for efficient, compact homes, rather than larger formats.
AIQYA Insight
At a structural level, Dubai’s residential market continues to exhibit a two-layer dynamic.
- Compact apartments act as the liquidity engine, driven by investor participation and relatively accessible entry prices.
- Larger units, while fewer in number, provide stability, reflecting end-user demand and longer holding periods.
The persistence of this balance even during short-term global volatility is a key indicator of market resilience.
Price Trends & Market Interpretation
The median price for residential apartment transactions during the first half of March remains broadly aligned with levels observed in late 2025 and early 2026. At approximately AED 1,500–1,550 per sq ft, there is no immediate indication of price dislocation in response to recent global volatility.
This stability is not unusual for Dubai. Unlike equity markets, where sentiment is reflected almost instantly, real estate tends to respond with a lag. Prices are often the last variable to adjust, while transaction behaviour shifts first.
What becomes more relevant, therefore, is not whether prices have moved, but whether the composition of transactions is beginning to change.
Early signals suggest that:
- Activity remains concentrated in mid-market price bands, particularly within the AED 1M–2M ticket range
- There is continued preference for smaller, efficient unit sizes, indicating sustained investor participation
- Off-plan pricing continues to hold, supported by ongoing developer launches and payment plan structures
At the same time, there is no clear evidence of aggressive upward pressure on prices within this short window. This suggests that while demand remains intact, the market is currently operating in a phase of measured absorption rather than acceleration.
Interpretation
Price stability in the immediate aftermath of external volatility indicates that buyer conviction has not weakened in the short term. Instead, the market appears to be maintaining equilibrium, supported by steady transactional activity and continued absorption of new supply.
AIQYA Insight
In Dubai, early-stage market shifts rarely appear in price metrics. They emerge first in who is buying, what they are buying, and at what ticket size.
The current data suggests that liquidity remains intact, but the absence of sharp price movement points toward a market that is consolidating rather than expanding in this phase.

Primary vs Secondary Market Composition
Off-Plan vs Ready Transactions
| Segment | Transactions | Share |
| Off-Plan | ~2,475 | ~55% |
| Ready | ~2,024 | ~45% |
Interpretation
Off-plan transactions continue to hold a slight majority share, accounting for just over half of total residential apartment deals in the first half of March.
This is a critical signal. In periods of uncertainty, off-plan activity is typically the first to slow, as investors tend to defer forward commitments. However, the data suggests that developer-led inventory continues to attract capital, indicating that investor confidence has not materially weakened in the short term.
The ready market, meanwhile, remains a strong secondary layer, contributing nearly half of total transactions. This segment is typically driven by end-users and yield-focused buyers, offering immediate usability and rental income potential.
The balance between these two segments reflects a market that is not skewed toward defensive behaviour, but rather continues to operate across both investment and end-use demand.
AIQYA Insight
Dubai’s residential market is structurally tied to its launch cycle dynamics.
- When off-plan activity dominates significantly, it reflects strong developer pipelines and forward-looking investor sentiment
- When ready transactions rise sharply, it often signals a shift toward safety and immediate utility
At present, the near-even split suggests a market that is balanced rather than reactive, with both segments continuing to function without disruption.
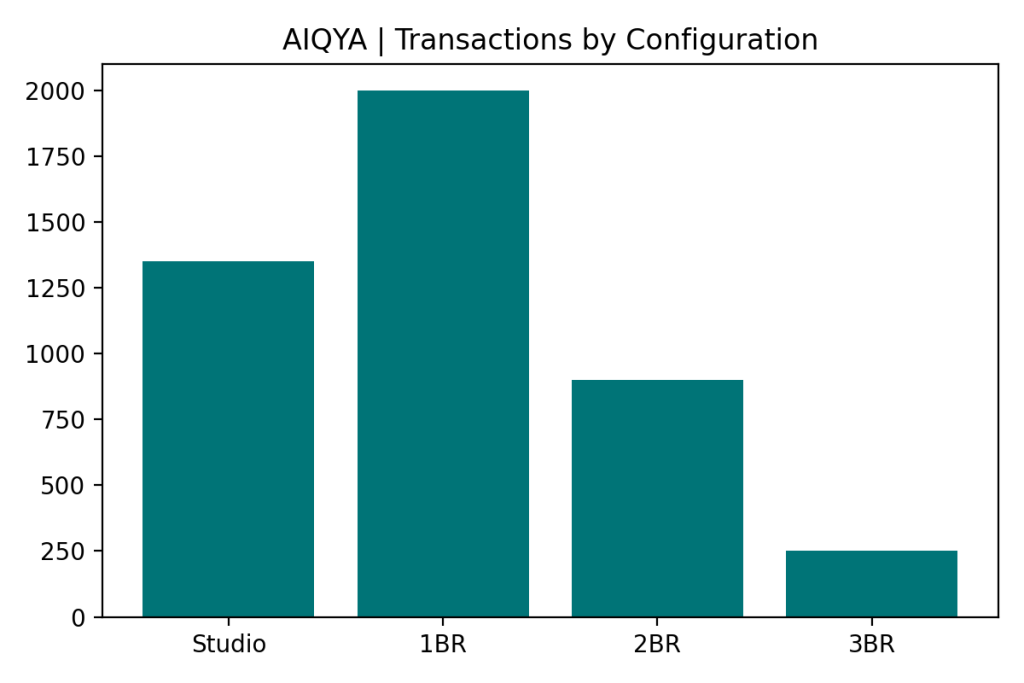
Configuration Distribution – What Are Buyers Choosing?
| Configuration | Transactions | Share |
| Studio | ~1,350 | ~30% |
| 1 Bedroom | ~2,000 | ~44% |
| 2 Bedroom | ~900 | ~20% |
| 3 Bedroom & Above | ~250 | ~6% |
Interpretation
The distribution clearly reinforces Dubai’s well-established demand structure.
Studios and 1-bedroom apartments together account for nearly three-fourths of all transactions, making them the dominant trading layer of the market. These units are typically driven by:
- investors targeting rental yield
- international buyers entering at lower ticket sizes
- short- to medium-term holding strategies
The 1-bedroom segment alone represents the largest share, indicating a preference for units that balance affordability with usability.
2-bedroom units form a secondary layer, catering to a mix of investors and smaller families, while 3-bedroom and larger apartments remain a relatively small portion of total transactions, reflecting their higher ticket sizes and end-user orientation.
AIQYA Insight
Dubai’s residential market operates as a two-speed system:
- Compact units act as the liquidity engine, enabling high transaction velocity and continuous capital flow
- Larger configurations serve as the lifestyle ballast, with fewer transactions but longer holding periods and stronger end-user intent
The dominance of smaller units in the current dataset indicates that investor-driven demand remains firmly in control of transaction activity, even during periods of external uncertainty.
Unit Size Trends & Market Signals
| Size Range (sqm) | Transactions | Share |
| < 50 sqm | ~900 | ~20% |
| 50 – 80 sqm | ~1,800 | ~40% |
| 80 – 120 sqm | ~1,200 | ~27% |
| 120 – 180 sqm | ~450 | ~10% |
| 180+ sqm | ~150 | ~3% |
Interpretation
The majority of transactions are concentrated in the 50–80 sqm and 80–120 sqm ranges, which together account for nearly two-thirds of total activity.
This aligns closely with the dominance of 1-bedroom and compact 2-bedroom configurations, indicating a strong preference for efficient, space-optimized homes.
Units below 50 sqm, largely studios, continue to form a significant portion of the market, reinforcing the role of entry-level investments in sustaining transaction volumes.
Larger units above 120 sqm represent a much smaller share, reflecting:
- higher ticket sizes
- lower investor participation
- a more selective, end-user-driven demand base
AIQYA Insight
Dubai’s residential market is gradually evolving toward efficiency-led design rather than size-led aspiration.
- Developers are increasingly aligning supply toward compact, functional layouts that maximize usability within smaller footprints
- Buyers, particularly investors, are prioritising ticket size and yield over absolute area
This convergence between developer strategy and buyer preference is one of the key reasons why transaction volumes remain resilient even during uncertain periods.
At the same time, the limited share of larger units highlights a parallel market, one that is less liquid but more stable, driven by long-term residential needs rather than short-term capital flows.
A Note on Villas in the Residential Market
While this analysis focuses on freehold residential apartment transactions, Dubai’s broader residential market also includes a significant villa and townhouse segment.
Villas typically operate as a distinct layer within the market:
- transaction volumes are lower compared to apartments
- ticket sizes are substantially higher
- demand is primarily driven by end-users and long-term residents
Unlike apartments, where investor-led liquidity drives activity, villa transactions tend to reflect lifestyle decisions and longer holding horizons.
Interpretation
The absence of villa data in this dataset does not indicate a lack of activity, but rather reflects the scope of the current analysis, which is restricted to apartment transactions for consistency and comparability.
AIQYA Insight
Dubai’s residential market functions as a dual-layer system:
- Apartments form the liquidity engine, driven by investor participation and accessible entry points
- Villas act as the lifestyle ballast, anchoring the market through end-user demand and long-term ownership
Understanding both layers is essential to interpreting the market accurately, even when they are analysed separately.
Top Projects & Developer Activity
Where Is Liquidity Flowing?
| Project | Transactions |
| Timez by Danube | ~180+ |
| City Walk Crestlane (phases) | ~150+ |
| Lana on the Park | ~130+ |
| Samana (multiple projects) | ~120+ |
| Binghatti (multiple projects) | ~110+ |
| Sobha Hartland II (projects) | ~100+ |
| Damac Lagoons / Hills clusters | ~90+ |
| Azizi developments (multiple) | ~80+ |
(Aggregated where multiple phases/projects exist within the same master development)
Interpretation
Transaction activity during the first half of March appears to be highly concentrated across a set of active developer-led projects, rather than being evenly distributed across the market.
Several patterns emerge:
- Newer launches and recently marketed phases continue to attract strong absorption
- Developers offering competitive entry prices and structured payment plans remain central to transaction volumes
- Branded mid-market developers with high-frequency launches are consistently present across the top activity list
The clustering of transactions within a relatively small number of projects reinforces the idea that Dubai’s market is not purely organic, but strongly influenced by launch cycles and developer activity.
AIQYA Insight
Dubai’s residential market operates on a launch-driven liquidity model.
- A significant portion of transactions is absorbed by a handful of active projects at any given time
- Developer timing, pricing strategy, and payment plans play a critical role in shaping short-term market activity
In short-cycle windows such as this 15-day period, understanding which projects are active often provides more insight than looking at broader averages alone.
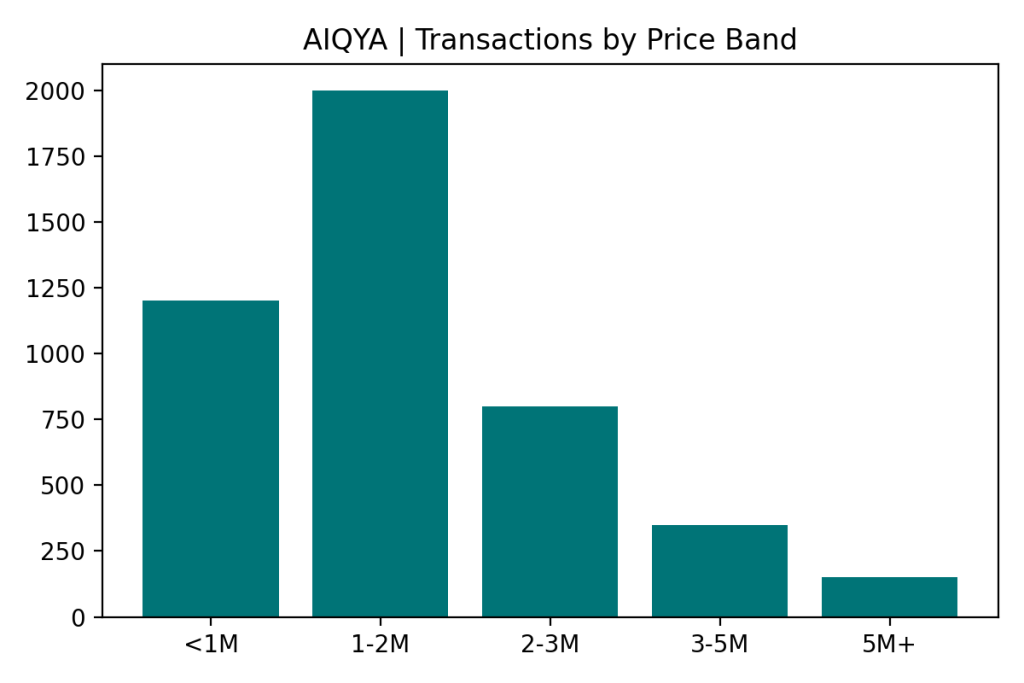
Affordability Snapshot – Where Buyers Are Spending
| Price Band (AED) | Transactions | Share |
| Below 1M | ~1,200 | ~27% |
| 1M – 2M | ~2,000 | ~44% |
| 2M – 3M | ~800 | ~18% |
| 3M – 5M | ~350 | ~8% |
| Above 5M | ~150 | ~3% |
Interpretation
The distribution clearly shows that nearly half of all transactions are concentrated in the AED 1M–2M range, making it the single largest price band in the market.
When combined with transactions below AED 1M, over 70% of all deals fall under the AED 2M threshold, highlighting the strong dominance of mid-market and entry-level segments.
This aligns closely with:
- the configuration trend toward studios and 1-bedroom units
- the size preference for compact homes
- continued investor participation in lower ticket sizes
Higher price bands, particularly above AED 3M, represent a much smaller share of activity. These transactions are typically driven by end-users or long-term investors, rather than short-cycle capital.
AIQYA Insight
Dubai’s residential market is fundamentally anchored in affordability-led liquidity.
- The AED 1M–2M segment functions as the core trading band, where most investor capital is deployed
- Lower ticket sizes ensure faster absorption and higher transaction velocity
- Higher price segments, while smaller in volume, contribute to market depth and stability
This concentration of activity in accessible price bands is one of the key reasons why transaction volumes remain resilient, even during periods of external uncertainty.
Buyer Profile & Demand Lens
The transaction patterns observed during the first half of March point toward a market that continues to be largely investor-driven at the entry and mid-market levels, while retaining a stable layer of end-user demand in higher configurations.
The dominance of studios and 1-bedroom units, combined with strong activity in the AED 1M–2M price band, indicates that a significant portion of buyers are focused on:
- relatively accessible entry points
- rental yield potential
- shorter to medium-term holding strategies
These buyers are typically more responsive to pricing, payment plans, and launch cycles, which explains the continued strength of off-plan transactions within the dataset.
At the same time, the presence of 2-bedroom and larger units, though smaller in share, reflects a parallel segment of demand driven by:
- end-users seeking primary residences
- long-term investors prioritising stability over yield
- families transitioning from rental to ownership
This segment tends to be less reactive to short-term market movements and is more influenced by lifestyle considerations and long-term planning.
Interpretation
The current data suggests that investor participation remains active and largely unaffected in the short term, particularly within the market’s core affordability bands.
End-user demand continues to provide a steady secondary layer, but does not dominate transaction volumes within this 15-day window.
AIQYA Insight
Dubai’s residential market is shaped by distinct buyer cohorts operating simultaneously:
- Investors drive transaction velocity, particularly in compact units and mid-ticket segments
- End-users anchor market stability, primarily in larger configurations and higher ticket sizes
The coexistence of these two demand layers is what allows the market to maintain both liquidity and resilience, even during periods of external uncertainty.
Rental Trends & Yield Outlook
The rental market continues to act as the underlying support system for Dubai’s residential transactions.
What stands out clearly is the alignment between rental demand and transaction activity. The same configurations driving sales – studios and 1-bedroom units are also the most active in the rental market.
This confirms that the current cycle remains yield-supported, not purely appreciation-driven.
Rental Levels – Configuration Snapshot
| Configuration | Median Annual Rent (AED) | Market Positioning |
| Studio | 43,000 | Entry-level, high churn |
| 1 Bedroom | 53,130 | Core rental segment |
| 2 Bedroom | 70,000 | Family + shared occupancy |
| 3 Bedroom | 108,000 | Limited rental pool |
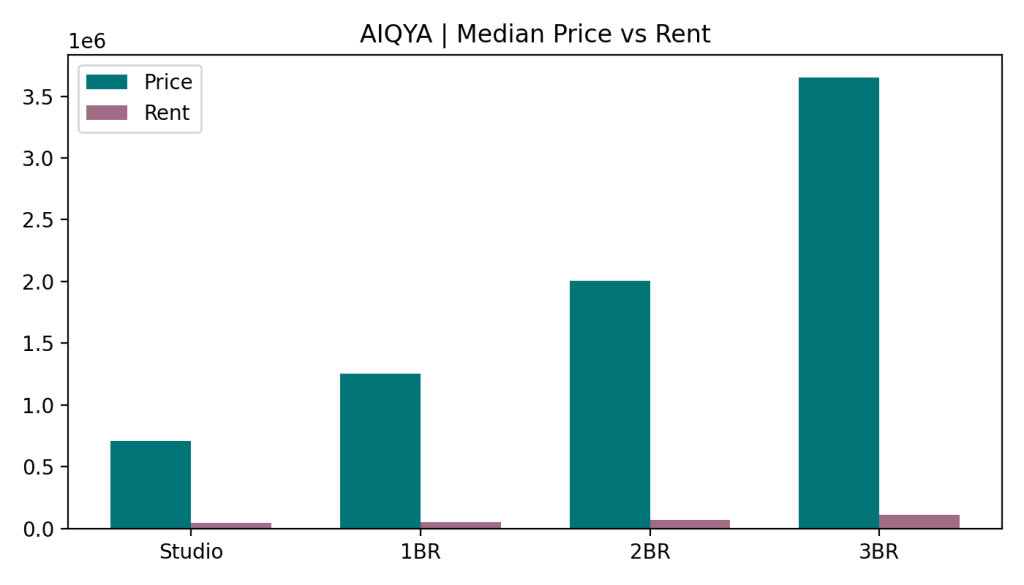
Gross Rental Yield – Configuration View
| Configuration | Median Sales Price (AED) | Median Rent (AED) | Gross Yield (%) |
| Studio | 710,117 | 43,000 | 6.1% |
| 1 Bedroom | 1,255,114 | 53,130 | 4.2% |
| 2 Bedroom | 2,003,888 | 70,000 | 3.5% |
| 3 Bedroom | 3,654,000 | 108,000 | 3.0% |
What the Data Is Really Saying
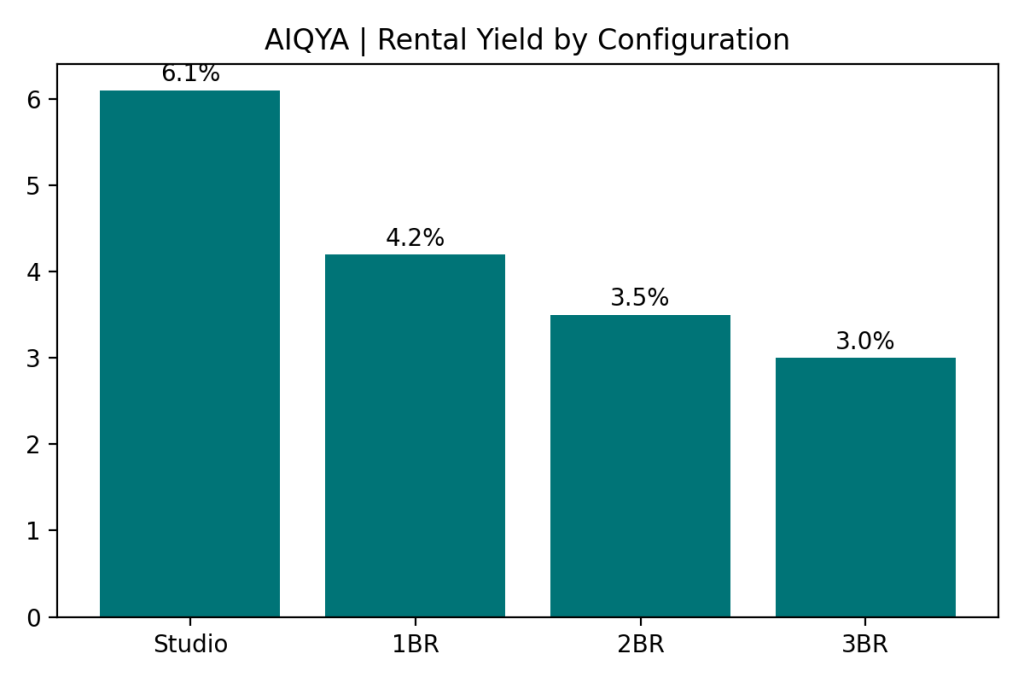
1. Yield Is Concentrated in Compact Units
- Studios deliver the highest yields (~6%)
- 1BRs form the core investment segment (~4.2%)
This explains why:
- transaction volumes are concentrated here
- off-plan launches are heavily skewed toward these configurations
2. Clear Yield Compression Curve
There is a very visible gradient:
- Studio → 6.1%
- 1BR → 4.2%
- 2BR → 3.5%
- 3BR → 3.0%
This is not random – it reflects a structural market behaviour:
- Smaller units → investment-driven
- Larger units → end-user driven
3. Studios: High Yield, Higher Friction
While studios lead on yield:
- tenant churn is higher
- leasing cycles are shorter
- operational stability is lower
This makes them:
efficient financially, but less stable operationally
Interpretation
The rental market is healthy and aligned with transaction behaviour, which is the key reason the current cycle is holding.
- Yields are still attractive in entry segments
- Rental absorption supports investor participation
- No visible stress in rental pricing yet
However, the market is clearly dependent on yield performance in compact units.
AIQYA Insight
In Dubai, yield is the first signal of change.
- If studio yields drop below ~5.5%
- If 1BR yields compress toward ~3.5–4%
→ investor demand will begin to soften
→ transaction volumes will adjust before prices do
At present:
yields are holding
which means the cycle is still intact
Configuration Spotlight – Project-wise Breakdown
The configuration mix across leading projects shows that Dubai’s residential market is not moving in a uniform way. Different projects are absorbing liquidity through different product strategies, and that distinction matters.
A first cluster of active projects is clearly built around the 1-bedroom-led mid-market formula. Projects such as Skyvue, Hado By Beyond, and AVENEW888-LOOM show strong concentration in 1-bedroom inventory, reinforcing the continued strength of compact homes that sit within relatively accessible ticket sizes.
A second cluster is more studio-driven, with projects like SIERRA BY IMAN, Maybach Six, and Samana Boulevard Heights showing notable traction in smaller units. These projects are likely benefiting from buyers seeking lower entry points, stronger headline affordability, and rental-led investment logic.
There is also a smaller but important set of projects where 2-bedroom units hold meaningful weight, including developments such as Windsor House II and Evelyn on the Park. This points to a parallel layer of demand coming from buyers who are looking beyond pure entry-level investing and toward more usable, family-oriented layouts.
Interpretation
What stands out is that the market is not simply favouring “small units” in a broad sense. It is segmenting more precisely:
- some projects are winning through studio-led affordability
- others through 1-bedroom liquidity
- and a smaller group through 2-bedroom liveability
This suggests that buyer demand is becoming more targeted, and that project positioning remains critical to absorption.
AIQYA Insight
In Dubai, configuration mix is not just a design decision. It is a market strategy.
Projects dominated by studios and compact 1-bedrooms tend to function as transaction accelerators, attracting investors and price-sensitive buyers. Projects with stronger 2-bedroom participation often indicate a more balanced demand profile, where liveability begins to matter alongside yield.
That split is important because it reveals a market that is still liquid, but increasingly shaped by micro-positioning rather than broad momentum alone.
Risks & Watchpoints
While the first half of March reflects a market that continues to operate with stable liquidity, there are a few underlying factors that warrant closer attention, particularly in a short-cycle environment.
1. Concentration in Compact Units
A significant share of transactions remains concentrated in studios and 1-bedroom apartments, as well as in the sub-AED 2M price band.
While this supports liquidity, it also creates a degree of dependence on investor-driven demand. Any slowdown in investor participation whether due to global financial conditions or shifts in rental expectations could impact transaction volumes in this segment first.
2. Dependence on Developer Launch Cycles
The continued dominance of off-plan transactions highlights the market’s reliance on new project launches and developer-led sales strategies.
In the absence of active launches:
- transaction volumes can soften
- liquidity may become uneven across locations
- pricing power could shift more toward the ready market
This makes the market sensitive not just to demand, but also to timing and pipeline management by developers.
3. Limited Movement in Price Signals
Price levels have remained broadly stable within this 15-day window. While this reflects resilience, it also means that any early signs of slowdown are unlikely to appear in pricing immediately.
Instead, initial signals would likely emerge through:
- reduced transaction volumes
- shifts toward smaller ticket sizes
- increased share of ready property transactions
4. External Volatility and Capital Flows
Dubai’s real estate market is closely linked to global capital flows. Periods of external uncertainty can influence:
- investor confidence
- currency dynamics
- cross-border capital movement
While no immediate disruption is visible in the current dataset, sustained volatility could begin to affect transaction composition in the coming weeks.
Interpretation
The current data reflects a market that is functioning normally, but with structural dependencies that should be monitored closely. These are not immediate risks, but rather watchpoints that could shape short-term market behaviour.
AIQYA Insight
Dubai’s residential market rarely shifts abruptly. Instead, it adjusts through gradual changes in transaction behaviour before price movements follow.
Monitoring these early indicators particularly configuration mix, ticket sizes, and off-plan share will be critical in assessing whether the current phase remains stable or begins to transition.
Supply Snapshot – What’s in the Pipeline
The first half of March suggests that transaction momentum is still being supported by an active launch environment. That is consistent with the broader shape of Dubai’s residential pipeline, where the volume of homes scheduled for delivery remains elevated, even if actual completions are likely to trail headline estimates. Knight Frank’s latest Dubai residential review says the registered projects pipeline points to more than 160,000 units potentially entering the market in 2026, while also noting that actual delivery rates tend to be materially lower than scheduled figures. Apartments account for the overwhelming majority of this expected supply.
That distinction matters. Dubai often looks oversupplied on paper, but real delivery is usually more staggered. Knight Frank notes that only 64% of scheduled homes were completed on time in 2025, following 50% in 2024, which helps explain why launch activity can remain strong without immediately translating into full supply pressure on prices.
Within that context, the current 15-day transaction window reads less like a market struggling under excess stock and more like one still moving through a launch-led absorption cycle. The dominance of off-plan transactions in the dataset supports that reading. Buyers are still willing to commit to future inventory, and developers continue to rely on structured payment plans and phased releases to maintain momentum.
Interpretation
The pipeline is large, but the more relevant question is not how much has been announced. It is how much will actually be delivered, and at what pace. For now, transaction activity suggests that the market is still absorbing supply through active launches rather than reacting to a sudden flood of completed inventory.
AIQYA Insight
Dubai’s residential market is often shaped by the gap between announced supply and delivered supply. That gap is one of the reasons the market can sustain high launch volumes without immediate pricing stress. In practical terms, it means pipeline numbers should be watched closely, but interpreted with caution.
Final Observations & Buyer Takeaways
The first half of March does not signal a shift in direction. Instead, it reinforces the underlying structure of Dubai’s residential market.
What stands out is not volatility, but continuity.
Transaction activity remains healthy. Off-plan continues to anchor volumes. The AED 1M–2M segment is still doing the heavy lifting. And pricing, at least within this short window, remains broadly stable.
At a surface level, this looks like a market in equilibrium.
But underneath, the drivers are very specific.
- Demand is still investor-led, particularly in compact configurations
- Liquidity is supported by developer launches and payment plans
- Supply is pipeline-heavy but delivery-staggered
- Price signals are slow-moving and lagging indicators
This is not a market where everything is rising uniformly. It is a market that is selective, structured, and timing-sensitive.
What This Means for Buyers
For End Users
The current phase offers relative stability in pricing, especially compared to earlier volatility cycles. However, choice is increasingly shaped by what is being launched, not just what is available in the ready market.
- Focus on livability over launch hype
- Evaluate layout efficiency and long-term usability, not just ticket size
- Be mindful of handover timelines and actual delivery track records
For Investors
The market continues to favour entry-level ticket sizes and efficient units, but this also means competition is concentrated.
- Rental yield assumptions need to be tested against real data, not projections
- Exit depends heavily on timing within the launch cycle
- Overexposure to a single configuration segment can increase risk
Closing Note
Dubai’s residential market rarely turns abruptly.
It adjusts through small, observable shifts in behaviour:
- the kind of units being sold
- the size of tickets being transacted
- the balance between off-plan and ready
This dataset reflects a market that is still functioning within its current cycle. The more important question is not what has happened in these 15 days, but whether the next set of data begins to show subtle changes in these patterns.
Data Source Attribution
- Dubai Land Department (DLD) – Transactions & Lease Contracts
- Period: 1–15 March 2026
- Scope: Residential Freehold Apartments only
- Method: Median-based calculations; configuration inferred using size bands where required
Disclaimer
Figures are based on official registered datasets. Minor gaps may exist due to naming inconsistencies or exclusions. Report is intended for insight and education, not financial advice.