
The Dubai real estate market April 2026 enters the month with recent memory still fresh.
- Key Market Metrics
- Price Trends & Market Interpretation
- Primary vs Secondary Market Composition
- Configuration Distribution – What Are Buyers Choosing
- Unit Size Trends & Market Signals
- Top Projects & Developer Activity
- Affordability Snapshot – Where Buyers Are Spending
- Rental Trends & Yield Outlook
- Configuration Spotlight – Project-wise Breakdown
- Risks & Watchpoints
- Supply Snapshot – What’s in the Pipeline
- Observations & Buyer Takeaways
The first quarter established a system that was active but contained, defined by stable pricing, strong off-plan participation, and a clear concentration of demand within compact, mid-market homes. March then introduced a moment of friction. Transaction volumes slowed, but the underlying structure did not shift. Pricing held. Buyer behaviour remained unchanged. The market absorbed the interruption without altering its core.
The market did not weaken under pressure. It became more selective.
April begins to reveal what happens next.
When activity resumes, it does not return evenly across the market. It concentrates.
The first fifteen days of April show a market where transaction depth remains strong, but where capital is being channelled more decisively into developer-led inventory. Off-plan transactions account for over four-fifths of activity in this window, reinforcing the role of launch-driven supply as the primary entry point for buyers.
This matters because off-plan demand is not passive. It reflects forward commitment. Buyers are not stepping back into completed assets. They are continuing to engage with projects under construction, aligning with timelines, payment plans, and future positioning.
In periods of uncertainty, markets typically broaden cautiously or shift defensively. This dataset suggests neither. Instead, liquidity appears to be flowing through a narrower channel, concentrated in segments that are already structurally aligned with the way Dubai’s market operates.
What emerges is not a break in momentum, but a refinement of it.
The market is not retreating.
It is becoming more precise in how it moves.
Key Market Metrics
April 1–15, 2026 | Freehold Residential Apartments
| Metric | Value |
| Total Transactions | 4,695 |
| Total Transaction Value | AED 10.39B |
| Off-Plan Share | 82.1% |
| Ready Share | 17.9% |
| Median Ticket Size | AED 1.50M |
| Median Price | AED 1,838.94 / sq ft |
| Median Unit Size | 75.6 sqm |
📝 Interpretation
The first half of April reflects a market that has resumed activity without losing depth. Transaction volumes remain strong for a 15-day window, indicating that participation has not withdrawn in response to recent external conditions.
What has changed is not the level of activity, but its composition.
Off-plan transactions now dominate at over 80%, a noticeable increase from the already high levels observed through Q1 and March. This suggests that liquidity is not dispersing evenly across the market, but is being absorbed more aggressively within developer-led supply.
Median ticket sizes remain anchored within the AED 1M–2M band, reinforcing the continued role of mid-market apartments as the core of transaction activity. At the same time, unit sizes remain compact, indicating that buyers are still prioritising efficiency over scale.
🧭 AIQYA Insight
April does not signal a market turning cautious.
It signals a market becoming more selective.
Liquidity has not left the system. It has concentrated further into the segments that already define its structure:
compact units
mid-market ticket sizes
and off-plan entry through payment-led absorption
If a broader slowdown were underway, it would first appear as a reduction in off-plan participation or a shift toward ready inventory. Neither signal is visible in this window.
Instead, the data suggests that the market continues to function within its existing cycle, with capital choosing precision over dispersion.
A Note on Scope
This analysis is restricted to freehold residential apartment transactions (April 1–15, 2026).
Villa and townhouse transactions follow a different volume and pricing structure and are excluded to maintain comparability across short-cycle datasets.
Price Trends & Market Interpretation
If March introduced a slowdown in transaction execution without disturbing pricing, April provides a second layer to that observation.
Pricing continues to hold.
The median price for residential apartment transactions during the first half of April sits at approximately AED 1,839 per sq.ft, marking a firm continuation of the range established through Q1. Rather than a breakout or a softening, it reflects a market that is absorbing activity without needing to be repriced.
That distinction becomes more relevant when placed against the backdrop of rising external noise.
In markets driven by sentiment, uncertainty tends to translate quickly into price movement. In Dubai’s residential market, the sequence is different. Pricing is typically the last variable to adjust. It follows behaviour, not the other way around.
What we are seeing in April reinforces that pattern.
Transaction volumes have returned to a healthy level for a 15-day window. Off-plan activity has strengthened further. Yet pricing remains within a controlled band, with no visible signs of discounting or acceleration.
The dominance of off-plan transactions also plays a direct role in price stability, as pricing is anchored at launch rather than continuously repriced in the secondary market.
What Is Driving This Stability
The answer sits in composition rather than headline movement.
A significant share of transactions continues to be concentrated in off-plan projects, where pricing is determined at launch and supported by structured payment plans. These projects do not respond to short-term fluctuations in the same way as resale markets. As long as absorption remains steady, pricing tends to hold.
At the same time, the dominance of compact configurations plays a stabilising role. Studios and 1BR units, which form the bulk of transactions, operate within tighter price bands. Their weight in the dataset prevents large swings in median pricing, even when transaction volumes change.
Ticket sizes reinforce this containment. The median transaction remains anchored around AED 1.5 million, indicating that buyers are not stretching into higher price brackets, but are continuing to transact within familiar affordability zones.
Parallel Pricing Lanes
It is also important to recognise that Dubai’s market is not operating on a single pricing curve.
There are two parallel lanes:
- Off-plan pricing
Forward-looking, influenced by developer positioning, branding, and future value expectations - Ready market pricing
Present-focused, influenced by building age, livability, and immediate rental potential
In April, the dominance of off-plan transactions means that the overall median pricing reflects the first of these lanes more strongly. This does not indicate a broad-based increase in value across the city. It reflects where transactions are occurring.
📝 Interpretation
Price stability in the current window does not signal inertia. It signals control.
Despite external uncertainty and elevated market commentary, there is no evidence of pricing stress. Transactions continue to clear at established levels, supported by steady absorption of off-plan inventory and continued demand in mid-market segments.
More importantly, there is no indication of price-led correction. If sentiment had weakened materially, early signs would appear through:
- discounting in off-plan launches
- downward pressure in resale pricing
- a shift toward lower ticket sizes
None of these are visible in this dataset.
🧭 AIQYA Insight
In Dubai, pricing rarely leads the market. It confirms it.
March showed that transaction volume can slow without forcing price adjustments. April now shows that even as activity resumes and liquidity concentrates, pricing continues to operate within the same defined band.
This is not a market reacting to short-term events. It is a market functioning within a structure that prioritises absorption over rapid repricing.
The more important signal is not where prices are today, but where behaviour might shift next.
If there is a change ahead, it will appear first in:
- a softening of off-plan absorption
- a rise in ready transaction share
- or a migration toward lower ticket sizes
Until those shifts become visible, pricing is likely to remain an outcome of structure, not sentiment.
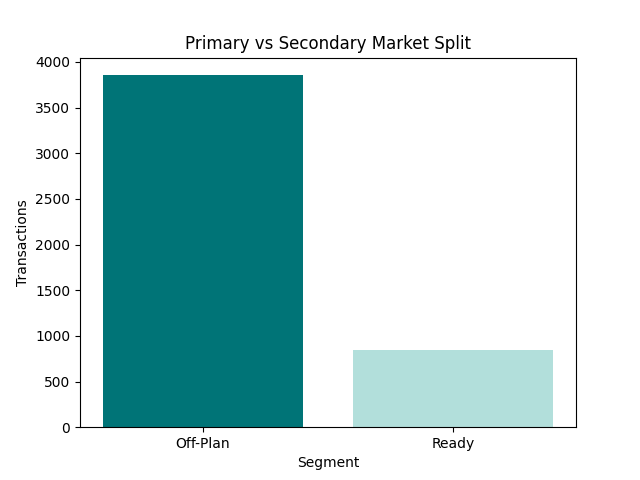
Primary vs Secondary Market Composition
Off-Plan vs Ready Transactions
| Segment | Transactions | Share |
| Off-Plan | ~3,855 | ~82.1% |
| Ready | ~840 | ~17.9% |
From Balance to Concentration
If March showed a market that held its structure under pressure, April shows how that structure reasserts itself when activity resumes.
The most visible shift is in the composition of transactions.
Off-plan activity now accounts for just over four-fifths of all transactions, a meaningful increase from the already dominant levels observed through Q1 (~75%) and March (~75–76%). This is no longer a near-balanced system. It is a clearly developer-led window, where new supply is absorbing the bulk of market liquidity.
The ready segment, by contrast, contracts to less than one-fifth of total transactions. This does not indicate a collapse in resale demand, but it does suggest that capital is not distributing evenly across both segments. It is choosing where to participate.
What This Tells Us About Buyer Behaviour
In periods of uncertainty, markets often rotate toward immediacy.
Buyers prioritise:
- completed homes
- known outcomes
- immediate usability
That pattern is not visible here.
Instead, buyers continue to engage with:
- projects under construction
- staged payment structures
- future delivery timelines
This is an important distinction.
Off-plan transactions require forward commitment. They reflect not just participation, but confidence in continuity – confidence that the market environment, delivery timelines, and exit conditions will remain broadly intact.
The increase in off-plan share suggests that buyers are not stepping back. They are leaning into the structure that already defines the market.
Why Off-Plan Continues to Absorb Liquidity
This behaviour is not accidental. It is supported by the mechanics of how buyers enter the market.
- Staggered payment plans reduce upfront capital pressure
- Lower initial commitments allow flexibility during uncertain periods
- Launch pricing strategies anchor expectations before delivery
Together, these factors make off-plan transactions less sensitive to short-term disruption compared to the ready market, where full capital deployment is immediate.
This is why off-plan often remains resilient – and in this case, becomes even more dominant – during periods where sentiment might otherwise be expected to soften.
The Role of the Ready Market
While smaller in share, the ready segment continues to play a critical role.
It represents:
- end-user-driven demand
- yield-focused investors seeking immediate income
- buyers prioritising certainty over staged entry
Its reduced share in this window does not diminish its importance. Instead, it highlights the current direction of capital flow.
The ready market remains a stabilising layer, but it is not the primary driver of transaction volume in this phase.
📝 Interpretation
April does not show a market rotating toward safety.
It shows a market concentrating toward structure.
The increase in off-plan share indicates that liquidity is not dispersing across segments, but is being absorbed more aggressively within developer-led inventory. This suggests that buyer participation remains intact, but is being channelled through specific entry mechanisms rather than broad-based market activity.
🧭 AIQYA Insight
Dubai’s residential market is not just off-plan dominant. It is launch-cycle driven.
What April reveals is how that system behaves after a period of interruption:
- It does not rebalance immediately
- It does not broaden participation
- It concentrates liquidity into active supply
This does not reflect a defensive market.
It is a selective one, where capital flows toward segments that offer:
- structured entry
- predictable pricing
- and alignment with the market’s existing rhythm
If a shift were to occur, the first signal would not be price.
It would be here:
- a decline in off-plan share
- a rise in ready transactions
- or a widening distribution across segments
For now, none of those signals are visible.
Liquidity is not dispersing across the market. It is concentrating within it.
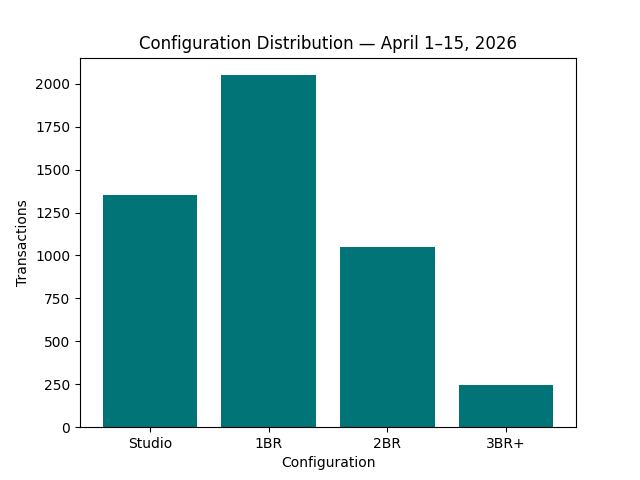
Configuration Distribution – What Are Buyers Choosing
| Configuration | Transactions | Share |
| Studio | ~1,350 | ~29% |
| 1 Bedroom | ~2,050 | ~44% |
| 2 Bedroom | ~1,050 | ~22% |
| 3 Bedroom & Above | ~245 | ~5% |
The Centre Still Holds
If April shows a sharper concentration of activity within the off-plan segment, the configuration mix confirms that the underlying demand structure remains unchanged.
Studios and 1-bedroom apartments together account for nearly three-fourths of all transactions, continuing to define the market’s primary layer of activity. This is consistent with what we observed through Q1 and March, where compact units formed the base of liquidity.
The 1-bedroom segment remains the single largest category, representing the most balanced format in the market – accessible in terms of ticket size, functional for end-use, and viable from a rental perspective.
Studios, while slightly lower in share, continue to provide the most efficient entry point, particularly for investors operating within tighter capital ranges.
No Defensive Compression
One of the key questions going into April was whether uncertainty would push buyers toward smaller, lower-commitment units.
That pattern is not visible.
The share of studios has not expanded disproportionately, nor has there been a contraction in 1-bedroom or 2-bedroom segments. The distribution remains broadly aligned with the quarter’s structure, suggesting that buyers are not reacting defensively by shifting downward in configuration.
At the same time, there is no expansion into larger formats. The share of 3-bedroom and above units remains limited, reinforcing the selective nature of end-user-driven demand.
The Role of 2-Bedroom Units
The 2-bedroom segment continues to act as a transition layer within the market.
At approximately one-fifth of total transactions, it reflects a mix of:
- investors moving beyond entry-level units
- smaller families seeking more usable space
- upgraders repositioning within the same affordability band
This segment does not drive volume in the same way as compact units, but it provides depth. It is where the market begins to move from pure liquidity toward more functional residential demand.
Why Compact Units Continue to Dominate
The persistence of this configuration mix is not incidental. It reflects a convergence between:
- Buyer preference → lower ticket sizes, higher liquidity
- Developer strategy → compact layouts aligned with price bands
- Rental demand → strongest absorption in smaller units
This alignment is what allows the market to maintain both volume and stability, even when external conditions introduce uncertainty.
📝 Interpretation
The April dataset shows that the market’s demand base has not shifted in response to recent events.
Compact units continue to drive the majority of transactions, with no visible movement toward either smaller or larger formats. This suggests that buyer behaviour remains consistent, and that the concentration observed in off-plan transactions is not accompanied by a change in what is being purchased.
🧭 AIQYA Insight
Dubai’s residential market continues to operate as a two-speed system:
- Compact units function as the liquidity engine, enabling continuous transaction flow
- Larger units act as the lifestyle ballast, providing stability through selective, end-user-driven demand
What April adds to this structure is not a change in configuration preference, but a reinforcement of it.
Liquidity has not shifted categories.
It has intensified within the same ones.
Unit Size Trends & Market Signals
| Size Range (sqm) | Transactions | Share |
| < 50 sqm | ~1,000 | ~21% |
| 50 – 80 sqm | ~1,950 | ~41% |
| 80 – 120 sqm | ~1,250 | ~27% |
| 120 – 180 sqm | ~380 | ~8% |
| 180+ sqm | ~115 | ~3% |
A Market Built Around a Narrow Band
The April dataset continues to cluster within a tightly defined size envelope.
Nearly two-thirds of all transactions fall between 50 and 120 sqm, reinforcing the dominance of compact 1-bedroom and smaller 2-bedroom configurations. This is consistent with the configuration distribution observed earlier, where studios and 1-bedroom units form the bulk of market activity.
Units below 50 sqm, largely studios, account for just over one-fifth of transactions. These represent the most efficient entry points into the market, particularly for investor-led demand.
Beyond 120 sqm, the market begins to thin out rapidly. Larger homes exist, but they do not carry volume. Their role remains selective, aligned more with end-user intent than with transaction velocity.
Efficiency Over Expansion
What stands out is not a reduction in size, but a refinement of it.
The median unit size remains anchored around 75 sqm, closely aligned with Q1 levels. This indicates that the market is not compressing further into smaller formats, but is continuing to operate within a size range that has already proven to be effective.
This is an important distinction.
Markets under pressure often show a shift toward smaller units as buyers reduce commitment. That behaviour is not visible here. Instead, the size distribution suggests a system that is optimising within an established band, rather than adjusting to external conditions.
Off-Plan vs Ready – A Subtle Contrast
Within this structure, a subtle difference remains between off-plan and ready inventory.
- Off-plan units tend to cluster within tighter size ranges, reflecting standardised layouts and pricing discipline
- Ready units show slightly larger sizes on average, particularly in 2-bedroom and above configurations
This reflects the nature of supply:
- Off-plan → designed for repeatability, efficiency, and alignment with price bands
- Ready → reflects older layouts, more variation, and occasionally more generous sizing
As off-plan dominates transaction volume, the overall size distribution increasingly reflects the former.
The Role of Design in Market Behaviour
The persistence of this size range points to a deeper alignment between:
- Design strategy → compact, functional layouts
- Pricing strategy → units that fit within the AED 1M–2M band
- Buyer expectation → usability within constrained ticket sizes
Developers are not pushing larger homes into the market at scale. They are refining layouts within smaller footprints to maximise both affordability and functionality.
This is where the market’s evolution becomes visible – not in expansion, but in precision.
📝 Interpretation
April does not show a shift in unit sizes.
It shows continuity within a defined size band, with the majority of transactions concentrated in compact, efficient homes. The absence of movement toward either smaller or larger formats suggests that buyer expectations and developer offerings remain closely aligned.
🧭 AIQYA Insight
Dubai’s residential market is not becoming smaller.
It is becoming more calibrated.
The dominance of units between 50 and 120 sqm reflects a system that has found its functional centre – a balance between affordability, usability, and rental viability.
As long as this alignment holds, transaction volumes can remain resilient without requiring expansion into larger formats or compression into smaller ones.
What emerges in April is that this centre is not shifting.
It is holding.
Top Projects & Developer Activity
Where Is Liquidity Flowing?
| Project / Cluster | Transactions |
| Timez by Danube | ~200+ |
| City Walk Crestlane (phases) | ~170+ |
| Lana on the Park | ~150+ |
| Samana (multiple projects) | ~140+ |
| Binghatti (multiple projects) | ~130+ |
| Sobha Hartland II (projects) | ~120+ |
| DAMAC clusters (Lagoons / Hills) | ~110+ |
| Azizi developments (multiple) | ~100+ |
(Aggregated where multiple phases or towers contribute to the same development cluster)
Liquidity Is Not Evenly Distributed
The April dataset makes one thing clear.
Transaction activity is not spread uniformly across the market.
It is concentrated within a relatively small set of active projects and developer pipelines.
This is consistent with what we observed through Q1, but April shows it more sharply.
The increase in off-plan dominance is not just a segment-level shift. It is a project-level phenomenon, where a handful of developments are absorbing a disproportionate share of transactions within a short time window.
Launch Cycles as the Market Engine
The clustering of transactions across these projects reinforces a structural characteristic of Dubai’s residential market:
It is not purely demand-driven. It is launch-driven.
Several patterns emerge:
- New launches and recently marketed phases continue to attract the highest absorption
- Developers with high-frequency pipelines appear repeatedly across the dataset
- Pricing strategies are aligned with the AED 1M–2M core band, enabling faster conversion
This is not a market where inventory clears evenly across all locations. It is a market where timing, positioning, and developer cadence determine where liquidity flows.
Repetition as a Signal
Unlike a traditional market where one or two projects dominate, April shows developer repetition rather than single-project dominance.
Names like:
- Danube
- Binghatti
- Samana
- DAMAC
- Azizi
appear multiple times, not through one flagship project, but through a series of launches and phases.
This indicates that volume is being built through:
- frequency of launches
- repeatable product formats
- consistent pricing strategies
rather than through isolated high-impact developments.
What This Means for the Market
This pattern aligns closely with what we observed in earlier sections:
- Off-plan dominance → driven by active launches
- Configuration mix → aligned with developer product strategy
- Price stability → supported by controlled launch pricing
In other words:
Projects are not just participating in the market.
They are shaping it.
📝 Interpretation
The April dataset indicates that transaction activity is highly dependent on where supply is actively being introduced, rather than being evenly distributed across the existing market.
The concentration of deals within a limited set of projects suggests that liquidity is being directed toward specific entry points, rather than reflecting broad-based absorption across all available inventory.
🧭 AIQYA Insight
Dubai’s residential market operates on a pipeline logic.
At any given time:
- a small group of active projects captures a large share of transactions
- developers with consistent launch cycles maintain visibility and absorption
- liquidity follows availability, not just location
This is why short-cycle datasets often reflect project clusters rather than market-wide averages.
April makes this particularly visible.
The increase in off-plan share is not just a demand signal.
It is a supply activation signal.
Capital is not just entering the market.
It is entering through specific doors.
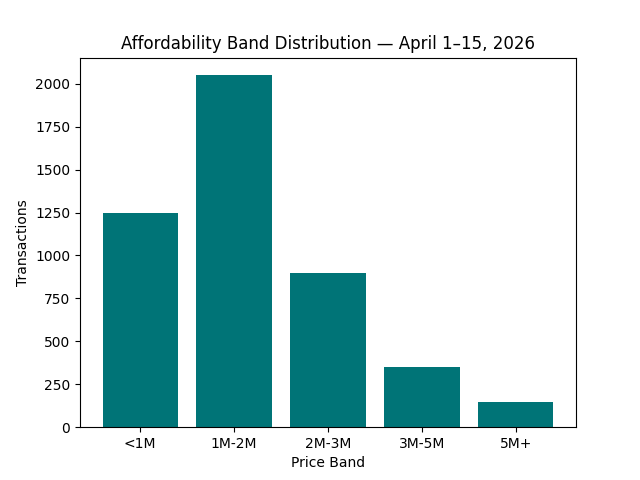
Affordability Snapshot – Where Buyers Are Spending
| Price Band (AED) | Transactions | Share |
| Below 1M | ~1,250 | ~27% |
| 1M – 2M | ~2,050 | ~44% |
| 2M – 3M | ~900 | ~19% |
| 3M – 5M | ~350 | ~7% |
| Above 5M | ~145 | ~3% |
The Core Band Remains Intact
The April data continues to reflect one of the most consistent patterns in Dubai’s residential market.
The AED 1M–2M segment continues to dominate, accounting for nearly half of all transactions within this 15-day window. This is more than a marginal lead; it defines the centre of gravity around which the market operates.
When combined with transactions below AED 1M, nearly 70% of all deals fall under the AED 2M threshold, highlighting the continued dominance of entry-level and mid-market segments.
This aligns directly with:
- the configuration mix (studios and 1BRs)
- the unit size distribution (compact formats)
- and the off-plan dominance (payment-plan-led entry)
The structure is not fragmented. It is tightly interconnected.
No Stretch, No Retreat
One of the key questions in the current environment is whether buyers are:
- stretching into higher price bands
- or retreating into lower ones
The data suggests neither.
There is no visible expansion into higher-value segments at scale. Transactions above AED 3M remain limited, forming a relatively small share of overall activity.
At the same time, there is no disproportionate shift toward sub-AED 1M transactions. While this segment remains active, it has not expanded significantly as a defensive response.
Instead, the market continues to transact within the same established affordability band, indicating that buyer capacity and pricing remain aligned.
The Role of the 2M–3M Segment
The AED 2M–3M band acts as a secondary layer within the market.
At just under one-fifth of total transactions, it reflects:
- 2-bedroom configurations
- early-stage upgrader activity
- buyers moving beyond entry-level investments
This segment does not define the market, but it supports it. It provides a transition zone between liquidity-driven purchases and more space-oriented decisions.
Higher Price Bands – Depth Without Volume
Beyond AED 3M, the market becomes increasingly selective.
These transactions:
- are fewer in number
- involve higher ticket commitments
- are often driven by end-users or long-term investors
While they contribute to overall market depth, they do not drive transaction velocity. Their role remains important, but peripheral in terms of volume.
📝 Interpretation
April confirms that the market’s affordability structure has not shifted.
Transactions remain concentrated within the AED 1M–2M band, with no visible movement toward either higher or lower price segments. This suggests that pricing remains aligned with buyer capacity, and that the increased concentration observed in off-plan activity is occurring within the same affordability framework.
🧭 AIQYA Insight
Dubai’s residential market is fundamentally anchored in affordability-led liquidity.
The AED 1M–2M segment functions as the market’s core trading band, where:
- investor participation is strongest
- product availability is highest
- and transaction velocity is most consistent
What April reveals is not a shift in this structure, but a reinforcement of it.
Liquidity has not expanded outward.
It has intensified at the centre.
Buyer Profile & Demand Lens
The April dataset does not point to a change in who is participating in the market.
It reinforces how the existing layers of demand are behaving under current conditions.
What emerges is a system that continues to be multi-layered, with each buyer segment operating within its own logic, yet converging around the same affordability and product bands.
Investor Layer – Still Driving the Engine
The most visible layer remains investor-led demand.
This is reflected clearly through:
- the dominance of studios and 1-bedroom units
- the concentration within the AED 1M–2M price band
- and the sharp increase in off-plan participation
These buyers are not entering the market through immediate ownership.
They are entering through structured commitment.
Off-plan transactions allow:
- staggered capital deployment
- flexibility during construction
- positioning for future exit or rental income
This makes the segment particularly resilient to short-term uncertainty.
April strengthens this observation.
The rise in off-plan share suggests that investor participation has not only remained intact, but has become more concentrated within developer-led inventory.
End-User Layer – Quiet, but Stable
The second layer is the end-user.
This segment is less visible in volume, but more stable in behaviour.
It appears more clearly in:
- the ready market
- 2-bedroom and larger configurations
- higher ticket transactions
For these buyers, the decision is not driven by timing or entry strategy, but by:
- livability
- immediate usability
- long-term residential value
The reduced share of ready transactions in this window does not indicate weakening end-user demand. It reflects the direction of capital flow, which is currently skewed toward off-plan.
End-users remain present, but they are not defining transaction velocity.
Upgrader Layer – The Transition Segment
Between these two sits the upgrader.
This segment typically operates within:
- the AED 2M–3M range
- 2-bedroom configurations
- selective off-plan or ready purchases
These buyers are:
- moving from smaller units to more usable space
- repositioning within the same market cycle
- balancing investment logic with lifestyle needs
While not dominant in volume, this layer provides continuity within the system. It connects the liquidity-driven segments with more space-driven demand.
A Shared Ground
What is notable is not just the presence of these segments, but where they overlap.
All three layers – investors, end-users, and upgraders continue to operate within a relatively narrow band:
- AED 1M–3M ticket range
- compact to mid-sized configurations
- projects aligned with current supply pipelines
This overlap is what keeps the market cohesive.
It allows:
- investors to drive volume
- end-users to anchor stability
- upgraders to create progression
without fragmenting demand across unrelated segments.
📝 Interpretation
April does not show a change in buyer composition.
It shows a refinement in how existing buyers are participating.
Investor demand remains the primary driver of transaction activity, particularly within off-plan projects. End-user demand continues to provide a stable secondary layer, while upgraders maintain a smaller but important transition segment.
The key difference is not who is buying, but where their capital is being directed.
🧭 AIQYA Insight
Dubai’s residential market is not driven by a single buyer profile.
It is sustained by aligned layers of demand, each playing a distinct role:
- investors → transaction velocity
- end-users → market stability
- upgraders → structural continuity
What April reveals is that under external noise, these layers do not disappear.
They reorganise within the same structure.
Liquidity does not exit the system.
It moves more deliberately within it.
Rental Trends & Yield Outlook
If transaction data reflects how capital is entering the market, the rental layer tells us whether that capital is supported by actual usage.
In April, that support remains firmly in place.
The first fifteen days of the month record approximately 12,271 rental contracts across freehold residential apartments. While lower in absolute scale compared to a full-month dataset, the number remains significant relative to the sales volume in the same period.
This relationship is structurally consistent.
It reinforces that Dubai’s residential market is not purely transactional.
It is an occupied system, where demand is sustained by real usage, not just capital movement.
Rental Levels – Holding Within the Same Band
The median annual rent during this period sits at approximately AED 68,000, slightly above the Q1 median of AED 64,000.
This movement is not sharp, but it is directionally consistent.
It indicates:
- no visible softening in rental demand
- continued absorption across active residential stock
- alignment with the same affordability bands driving sales
The rental base, in other words, remains intact.
Yield Alignment – The Underlying Support
When we align rental levels with the median transaction ticket of ~AED 1.5M, the implied gross yield remains in the range of:
~4.5% to 5.0%
This sits comfortably within the same band observed through Q1.
It does not indicate excess return.
But it does indicate sufficient alignment between price and income to sustain investor participation.
Why This Matters Now
This section is critical in the current context.
Because if external uncertainty were beginning to affect the market structurally, the first visible pressure would not necessarily appear in pricing.
It would appear in:
- rental softening
- vacancy-driven adjustments
- yield compression
None of these are visible in this dataset.
Instead, what we see is continuity.
Rental demand remains:
- broad
- active
- and aligned with transaction behaviour
Sales and Rental – Still Moving Together
One of the most important confirmations in April is the continued alignment between:
- what is being bought (compact, mid-ticket apartments)
- what is being rented (same segments driving occupancy)
This overlap is what sustains the system.
It ensures that:
- investor demand is not detached from usage
- pricing remains anchored
- and liquidity is supported from below
📝 Interpretation
April does not show any visible stress in the rental layer.
Rental levels remain stable to slightly firm, and contract volumes continue to indicate active occupancy. The alignment between sales pricing and rental income remains intact, suggesting that the market continues to be supported by underlying demand rather than speculative positioning.
🧭 AIQYA Insight
In Dubai, the rental market is not a secondary indicator.
It is the foundation of the cycle.
As long as:
- rental demand remains deep
- income aligns with pricing
- and occupancy continues across core segments
the transaction market can sustain itself without requiring immediate price adjustment.
The data in April indicates that this foundation has not weakened.
Liquidity in the sales market is still being supported by
real usage, not just expectation.
Configuration Spotlight – Project-wise Breakdown
The following observations are drawn from high-frequency project occurrences within the April dataset, where similar configurations show consistent variation in pricing and ticket sizes.
The April dataset shows that the market is not absorbing each configuration in a uniform way. Even within the same bedroom count, pricing, ticket size, and project-level traction vary sharply.
That matters because it tells us something important:
the market is not simply buying “studios” or “1-bedrooms” in the abstract.
It is buying positioned products.
Studios – Affordability Splits Fast Into Two Lanes
The studio segment continues to provide one of the clearest entry points into the market, but April shows how quickly this category splits into different pricing lanes.
At the higher-volume end, projects such as DAMAC Lagoons – Valencia are moving studios at sub-AED 1 million ticket sizes, with compact layouts around the mid-30 sqm range. That is classic entry-led liquidity.
But the category does not stop there.
Projects like Breez by Danube and Holm One show how similar-sized studios can be positioned at substantially higher price levels. In other words, within the same configuration, branding, location, and launch narrative are already creating meaningful spreads in ticket size and price per square foot.
The studio market, then, is not one segment.
It is at least two:
- yield-led affordability
- and premium-compact positioning
1-Bedroom Units – Still the Core Trading Layer
The 1-bedroom segment remains the market’s strongest transactional layer, but here too the variation is significant.
Projects such as Terra Woods and DAMAC Lagoons – Valencia are operating closer to the market’s core affordability structure, with ticket sizes that still sit within a relatively absorbable band.
At the same time, projects like Creek Bay, Sobha Central, and Imtiaz Symphony Tower show that 1-bedroom units are no longer a purely mid-market product. In some cases, they are being positioned well above the market median on a per-square-foot basis, while still maintaining traction.
This tells us two things:
- the 1BR segment remains highly liquid
- but liquidity does not necessarily mean sameness
The same configuration can function either as an accessible entry point or as an upper-mid-market asset, depending on how the project is positioned.
2-Bedroom Units – Where the Market Starts to Separate
The 2-bedroom category is where the April dataset begins to show a clearer two-speed structure.
At one end, projects such as South Square and Windsor House II are transacting in a more moderate pricing range, reflecting relatively practical, mid-market positioning.
At the other, projects like Creek Bay, Creek Haven, and Terra Woods show that 2-bedroom units can also operate at a much higher pricing level, with noticeably larger ticket sizes and stronger price-per-square-foot positioning.
This is where the market starts to move away from pure liquidity and toward more differentiated buyer intent.
The 2BR category is no longer just a larger version of the 1BR market.
It is the point where:
- investor logic
- upgrader demand
- and project branding
begin to intersect more visibly.
3-Bedroom and Above – Selective, Project-Led, Less Standardised
By the time we move into 3-bedroom and larger homes, the market becomes far less uniform.
April volumes here are smaller, but the variation is much wider.
Projects such as Creek Bay, Ellington Sands II, and The Edit at d3 show strong premium pricing within the 3-bedroom bracket, while other names such as Living Legends Phase 6 sit at a very different ticket level altogether.
In the 3BR+ layer, this becomes even more pronounced. A project such as Baccarat Hotel and Residences, Dubai sits in a completely different valuation zone from the rest of the market, while names like Hado By Beyond and Soulever’ By Beyond occupy a premium but more comparable range.
At this level, configuration stops being the primary explanatory factor.
The market is no longer pricing “bedroom count.”
It is pricing:
- project identity
- asset quality
- location
- and exclusivity
📝 Interpretation
April confirms that pricing differences within the same configuration are being driven less by size alone and more by project-level positioning.
This is especially visible in off-plan inventory, where branding, launch strategy, and micro-location are creating meaningful spreads even across similar layouts. The result is a market where the same bedroom count can occupy very different pricing lanes.
🧭 AIQYA Insight
This is where Dubai’s residential market becomes a true two-speed system.
Compact homes remain the liquidity engine, but even within that engine, projects are creating their own hierarchy of value.
The takeaway is simple:
- configuration explains market role
- project explains pricing power
April makes that distinction unusually clear.
Risks & Watchpoints
April does not present a market under visible stress.
Transaction activity remains firm. Off-plan absorption is strong. Pricing is holding. Rental support remains intact.
But that does not mean the system is without pressure points.
What it means is that the pressure, if it builds, is likely to emerge first through structure, not through abrupt headline breaks.
1. Concentration in Off-Plan Has Deepened
The most obvious watchpoint sits in the April composition itself.
With more than 80% of transactions flowing into off-plan, the market is becoming even more dependent on:
- continued launch absorption
- developer credibility
- buyer confidence in future delivery
- and the ongoing appeal of staged payment structures
This concentration is not a weakness by itself. It is part of how Dubai’s apartment market currently functions.
But it does create sensitivity.
If sentiment were to soften meaningfully, or if launch pipelines were to misread demand, the first effect would likely be seen here. Not necessarily through immediate price cuts, but through slower absorption, softer take-up, or a narrowing of active buyer participation.
2. The Market Is Leaning Heavily on Compact Units
Studios and 1-bedroom units continue to carry the bulk of activity.
That supports liquidity. It keeps pricing within reachable bands. It allows the market to move at scale.
But it also means the system remains highly exposed to the segment that is most investor-sensitive.
If pressure begins to build, it will likely appear first in:
- compact off-plan inventory
- the AED 1M–2M price band
- and product aimed primarily at yield-led buyers
In other words, the market’s greatest strength is also its most concentrated dependency.
3. Price Stability Still Needs Rental Support
So far, the rental layer continues to support the transaction market. That is one of the clearest positive signals in April.
But this alignment needs to hold.
If off-plan pricing continues to firm while rental growth remains moderate, the first structural adjustment will likely appear through yield compression, not through immediate transaction decline.
That matters particularly in the most traded segments, where investors are relying on:
- entry affordability
- manageable holding costs
- and a reasonable income base beneath purchase pricing
The system can absorb premium positioning for a time.
But it cannot detach indefinitely from rental logic.
4. Project-Level Dispersion Is Rising
April also reinforces that this is not a market moving uniformly.
The same configuration is transacting at very different price levels across projects. That reflects sophistication, but it also increases complexity.
As project positioning becomes a stronger determinant of pricing:
- comparability becomes harder
- mispricing risk rises
- and buyer decision-making becomes more narrative-driven at the project level
This is not necessarily a market-wide risk.
But it is a buyer-level watchpoint.
The more fragmented pricing becomes within the same bedroom count, the more important it becomes to distinguish between:
- category value
- and project-specific pricing power
5. External Noise Has Not Hurt the Market Yet – But It Has Not Disappeared Either
The current dataset does not validate the louder rumours circulating around regional uncertainty and its immediate impact on Dubai’s housing market.
That is important to state clearly.
But it would also be too simplistic to conclude that external conditions are irrelevant.
What April shows is that the market has not yet translated external anxiety into structural weakness.
That is different from saying risk has vanished.
Cross-border capital flows, buyer confidence, and launch appetite can all react with a lag. In a market shaped as strongly by forward commitments as Dubai’s, timing matters.
The immediate signal is stable.
The medium-term watchpoint remains open.
📝 Interpretation
The April dataset reflects a market that is functioning normally, but through a set of increasingly concentrated drivers.
The system remains healthy on the surface, yet it is becoming more reliant on:
- off-plan absorption
- compact unit liquidity
- and continued alignment between pricing and rental support
These are not stress signals today.
They are the conditions to monitor if market behaviour begins to shift.
🧭 AIQYA Insight
Dubai’s apartment market rarely turns through a single dramatic event.
It adjusts through small shifts in behaviour that appear before price reacts.
The key watchpoints are therefore not headline-level. They are structural:
- Does off-plan share begin to fall?
- Does ready inventory regain share?
- Do compact units lose velocity?
- Does pricing begin to move ahead of rental logic?
April does not show those signals yet.
But it does show clearly where they would emerge first.
Supply Snapshot – What’s in the Pipeline
April’s transaction data makes one thing clear.
The pipeline is not a background factor.
It is the primary channel through which the market is currently operating.
With over 80% of transactions concentrated in off-plan inventory, future supply is not just being introduced – it is being absorbed in real time. Buyers are committing to homes that are yet to be delivered, aligning themselves with timelines rather than immediate occupancy.
This fundamentally changes how supply needs to be read.
Pipeline Is Not Just Volume – It Is Product Alignment
At a headline level, Dubai continues to carry a substantial residential pipeline, with apartments forming the dominant share of upcoming supply.
But the April dataset suggests that the more relevant question is not how much is coming.
It is what kind of product is being absorbed most efficiently.
The answer remains consistent with earlier sections:
- compact configurations
- mid-market ticket sizes
- payment-plan-aligned entry points
Developers are not pushing product far outside this band.
They are largely reinforcing what the market is already able to absorb.
Absorption Before Delivery
One of the defining characteristics of Dubai’s market is the gap between:
- announced supply
- and delivered supply
April reinforces that this gap continues to play a stabilising role.
Transactions are being recorded at the launch stage, not at completion. This means that supply pressure is not hitting the market all at once. It is distributed over time, allowing pricing to remain stable even in the presence of a large pipeline.
In practical terms:
the market is not reacting to delivered stock
it is pre-absorbing future stock
Breadth of Supply – Not a Single-Project Cycle
Another important signal from April is that the pipeline is not concentrated within a single launch cycle.
As seen earlier:
- multiple developers are active simultaneously
- volume is distributed across several projects
- no single development dominates transaction share
This creates a broad-based pipeline, where supply is introduced through multiple entry points rather than a single surge.
That breadth is what supports continuity.
Where the Watchpoint Sits
While the pipeline remains aligned with demand today, it does introduce a medium-term question.
If the majority of supply continues to be:
- compact
- off-plan
- and investor-oriented
then the market becomes increasingly dependent on:
- sustained investor participation
- and continued rental support
If either of these weakens, supply may begin to arrive into a more selective demand environment.
This is not a current imbalance.
But it is the logical extension of the structure we are observing.
📝 Interpretation
The April data suggests that the pipeline remains closely aligned with current demand patterns.
Developers are not significantly diverging from what the market is absorbing. Supply is being introduced in formats and price bands that continue to find liquidity, supported by staged delivery timelines that prevent immediate pricing pressure.
🧭 AIQYA Insight
Dubai’s residential market is shaped by the gap between supply and delivery.
That gap allows the market to:
- sustain high levels of off-plan activity
- maintain pricing stability
- and absorb large volumes of future inventory over time
What April shows is that this mechanism continues to function.
The pipeline is not overwhelming the market.
It is moving with it.
This is not a market reacting to noise. It is a market following structure.
Observations & Buyer Takeaways
April does not introduce a new direction. It clarifies the one already in motion.
It clarifies how the existing system behaves after a moment of interruption.
Q1 established the structure.
March tested it.
April shows how it resumes.
A Market That Did Not Break – It Narrowed
What stands out in April is not volatility, but concentration.
Transaction activity remains strong for a short-cycle window. Pricing holds within the same band. Buyer behaviour shows no visible shift toward caution. Rental support remains intact.
But the way the market is moving has become more precise.
Liquidity is not dispersing across all segments.
It is flowing more decisively into:
- off-plan inventory
- compact configurations
- and mid-market ticket sizes
It is not a retreat in activity.
It is a narrowing of participation into what the market understands best.
Structure Over Sentiment
The external environment may be uncertain.
But the data does not show a market reacting to it in real time.
There is:
- no price correction
- no shift toward ready assets
- no contraction into lower ticket bands
Instead, the system continues to operate within the same structural drivers:
- developer-led supply
- investor-driven liquidity
- and rental-supported pricing
This is what defines the current phase.
The market is not being led by sentiment.
It is being held by structure.
What This Means for Buyers
For Investors
The market continues to favour:
- compact units
- off-plan entry
- and mid-ticket affordability
But this is also where competition is most concentrated.
The key question is no longer whether these segments will transact.
It is whether:
- pricing remains aligned with rental income
- and exit pathways remain as liquid as entry
Discipline now matters more than access.
For End Users
The ready market remains the quieter, more grounded layer.
It offers:
- immediacy
- known quality
- and clearer livability
While it does not dominate transaction volume in this phase, it continues to provide a stable alternative to launch-driven participation.
For buyers prioritising certainty over timing, this segment still offers a clearer read of value.
For Upgraders
The transition point remains consistent.
The AED 2M–3M range and 2-bedroom configurations continue to act as the bridge between:
- entry-level liquidity
- and space-driven decisions
At this level, project selection becomes more important than market averages.
This is where:
- pricing spreads widen
- and positioning begins to matter more than configuration
The Signal to Watch
Dubai’s residential market does not turn abruptly.
It adjusts through small, observable changes in behaviour.
The signals to watch remain the same:
- Does off-plan share begin to decline?
- Does ready inventory regain share?
- Do compact units lose velocity?
- Does pricing move ahead of rental support?
April does not show these shifts.
But it shows clearly where they would appear first.
Closing Note
This is not a market that has paused in its activity.
It is a market that has become more deliberate.
Capital has not left the system.
It has chosen its path more carefully.
And for now, that path remains clear.
Data Source Attribution
Dubai Land Department (DLD) – Transactions & Lease Contracts
Period: April 1–15, 2026
Scope: Residential, Freehold, Unit, Flat transactions
Methodology:
- Median-based calculations
- Price per sq.ft = TRANS_VALUE / (ACTUAL_AREA × 10.7639)
- Off-plan vs Ready taken directly from source field
- Deduplication: Unit + Project + Registration Date + Area
Rental Scope:
- Residential, Freehold, Unit rental contracts
- Gross yield derived from median rent vs median ticket
Disclaimer
Figures are based on official registered datasets. Minor gaps may exist due to naming inconsistencies or exclusions. This report is intended for insight and education, not financial advice.
You may also like:
Dubai Property Market Q1 2026: Structure, Pricing and Demand Trends
Dubai Property Market March 2026: What Held Under Pressure
Dubai Real Estate Market March 2026 – A Measured Shift Toward Balance