
- Market Overview
- Key Market Metrics
- Price Trends & Market Interpretation
- Primary vs Secondary Market Composition
- Configuration Distribution
- Unit Size Trends & Market Signals
- Top Projects & Developer Activity
- Affordability Snapshot
- Buyer Profile & Demand Lens
- Rental Trends & Yield Outlook
- Configuration Spotlight
- Risks & Watchpoints
- Supply Snapshot
- Final Observations & Buyer Takeaways
- Data Source & Method Note
Dubai residential market January 2026
January opened with a Dubai apartment market that was active, balanced, and structurally familiar. Based on 12,064 registered freehold apartment transactions, the month reflected steady absorption rather than directional exuberance. Pricing remained disciplined, buyer behaviour followed established patterns, and off-plan sales continued to anchor market activity.
Compact apartments dominated volumes, reinforcing their role as the market’s liquidity engine. Studios, 1BRs, and 2BRs accounted for the overwhelming majority of transactions, with buyer comfort concentrated between AED 750,000 and AED 2 million. Larger homes and higher-ticket purchases remained present but selective, behaving more like conviction-led decisions than volume drivers.
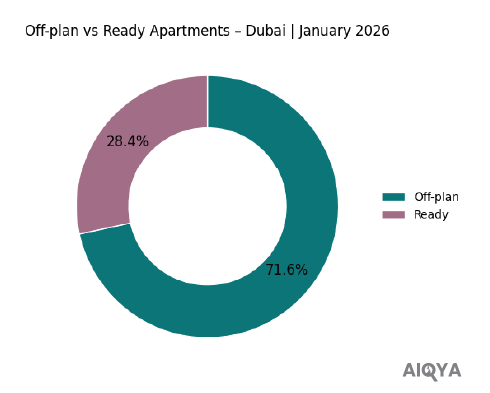
Off-plan transactions formed 71.6% of January activity, highlighting continued preference for structured payment plans and phased commitments over immediate handover. The secondary market remained active where product specificity justified it, particularly in established communities and well-positioned developments.
Rental indicators, read directionally, pointed to stable leasing conditions, supporting investor logic without signalling tenant stress. Hotel apartments, accounting for roughly 200 transactions, continued to function as a parallel, operator-led segment rather than part of the mainstream residential market.
Overall, January 2026 sets a credible baseline. Liquidity is intact, pricing discipline holds, and buyer behaviour remains rational. The month provides a clear reference frame against which February and March will reveal whether momentum builds, rotates, or holds steady.
Market Overview
| Dubai Residential (Freehold Apartments) | January 2026
January 2026 reflects a Dubai apartment market that is active without being hurried. Transaction volumes were broad-based, pricing remained anchored within familiar ranges, and buyer participation spanned both investment-led and end-user segments. Rather than signalling a shift in sentiment, the month establishes a measured starting point for the year.
Scope note: Residential, Freehold, Apartments only. Hotel Apartments included as a distinct sub-type.
Off-plan activity dominated the month, driven by launch-led supply and structured payment plans. At the same time, ready apartment transactions continued where location clarity and product specificity justified immediate commitment. Activity clustered across established liquidity corridors such as Jumeirah Village Circle, Dubai Land Residence Complex, Majan, and select urban districts, reinforcing the city’s familiar absorption geography.
Hotel apartments formed a small but visible layer of activity. These transactions are best read as structured-income placements rather than conventional home purchases and are treated separately in this report.
📝 Interpretation
January does not present a market in acceleration or retreat. It presents one organising itself around familiar anchors: compact units, phased commitments, and selective premium buying.
🧭 AIQYA Insight
Apartments tell us where liquidity sits. January confirms that liquidity remains intact and broadly distributed, providing a stable base for the quarter ahead.
Key Market Metrics
January’s numbers do not announce a turning point. Instead, they quietly establish the market’s operating range at the start of the year. Volumes were healthy, pricing held within familiar bands, and off-plan transactions continued to shape the overall composition of activity.
January 2026 – Market Scorecard
(Residential | Freehold | Apartments only | Flats + Hotel Apartments)
- Total transactions: 12,064
- Total transaction value: ~AED 25.9 billion
- Median price: ~AED 1,771 per sq ft
- Median ticket size: ~AED 1.38 million
- Off-plan share: 71.6%
- Ready (secondary) share: 28.4%
📝 Interpretation
The scale of activity confirms that liquidity remains intact. A median ticket near AED 1.4 million keeps the market squarely within investor and upgrader comfort zones, while pricing around AED 1,770 per sq ft reflects discipline rather than stretch. Importantly, these medians are shaped by mix: compact units and launch-led inventory exert more influence than secondary-market negotiation.
🧭 AIQYA Insight
January reads as a baseline month, not a momentum statement. When off-plan transactions account for more than two-thirds of activity, pricing signals are driven less by resale pressure and more by product design, payment structure, and launch positioning. This makes January an essential reference point. Any shift in February or March will be easier to identify against this stable starting frame.
Price Trends & Market Interpretation
January pricing needs to be read with restraint. Early-year transactions tend to reflect a reset in expectations rather than a decisive shift in sentiment. New launches, selective resale deals, and a preference for compact, tradeable units all feed into the month’s median, shaping how prices appear on paper without necessarily changing how buyers behave on the ground.
How prices behaved in January
- Citywide median pricing held near AED 1,800 per sq ft, a level that has now become a familiar anchor rather than a moving target.
- Off-plan pricing shaped the median, with launch-led inventory setting the tone more than secondary market negotiation.
- Price dispersion widened by location, with premium districts maintaining higher psf bands, while high-volume suburban markets pulled the overall median back toward affordability.
📝 Interpretation
January does not show a market stretching itself. Instead, it shows a market sorting itself.
Premium locations continued to command higher pricing, but without aggressive upward pressure. At the same time, value-led corridors absorbed volume efficiently, reinforcing the role of smaller, well-priced units in maintaining liquidity. The result is a median that looks stable, even as the underlying price bands remain wide.
This is an important distinction. Stability here does not mean uniformity. It means that buyers are choosing where to pay more, rather than paying more everywhere.
🧭 AIQYA Insight
January’s pricing is best understood as composition-led stability. When a month is dominated by off-plan launches and compact unit sizes, median psf becomes a reflection of mix rather than momentum. For analysts and buyers alike, this means January should be treated as a reference frame, not a directional signal. True price movement, if any, will only become visible as resale volumes reassert themselves later in the quarter.
Primary vs Secondary Market Composition
The split between off-plan and ready apartments in January offers one of the clearest readings of buyer preference at the start of the year. More than pricing alone, this balance reflects how buyers are choosing to manage flexibility, timing, and commitment in a market where choice remains abundant.
January 2026 – Market Split (Apartments Only)
- Off-plan apartments: 71.6%
- Ready (secondary) apartments: 28.4%
📝 Interpretation
Off-plan dominance in January is less a signal of speculative appetite and more a reflection of structure-led decision-making. Payment plans, phased commitments, and launch positioning continue to attract buyers who value flexibility over immediacy. This is particularly visible in the compact and mid-ticket segments, where capital staging matters as much as headline pricing.
The secondary market, while smaller in share, remained active where product specificity justified immediate commitment. Ready apartment transactions were driven by location clarity, established communities, and usable layouts, rather than volume-led trading.
🧭 AIQYA Insight
January reinforces a familiar two-speed pattern. Off-plan apartments act as the volume stabiliser, absorbing demand through structured offerings, while ready apartments act as the conviction layer, moving selectively when the product is distinct enough to warrant immediacy. This balance suggests confidence has not retreated from completed stock; it has simply become more discerning.
Configuration Distribution
– What Are Buyers Choosing?
January’s unit mix reads like a market leaning into liquidity first, with compact formats carrying the bulk of activity. Bigger homes did transact, but they behaved more like a conviction purchase than a volume segment.
Configuration split (Jan 2026 | Flats + Hotel Apartments)
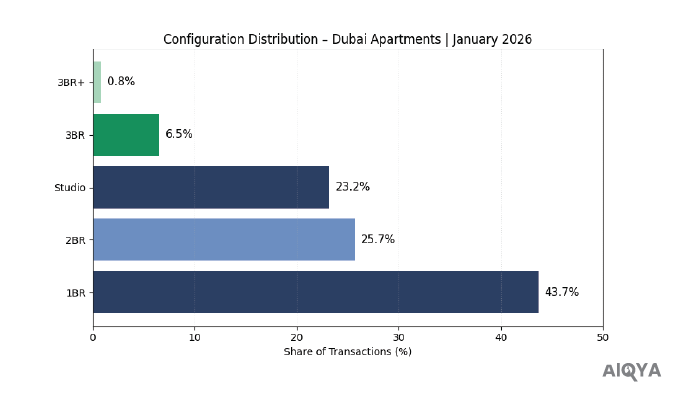
- 1BR: 5,278 (43.7%)
- 2BR: 3,103 (25.7%)
- Studio: 2,797 (23.2%)
- 3BR: 790 (6.5%)
- 3BR+: 95 (0.8%)
- Unknown/Other: 1 (negligible)
📝 Interpretation
The month was driven by the compact core (Studios + 1BR + 2BR = ~92.6% of transactions). This is the market’s liquidity engine in action: lower entry tickets, easier exit, and broader buyer pools.
🧭 AIQYA Insight
January’s mix suggests buyers were optimising for tradeability and flexibility rather than stretching for space. Larger formats remained present but thin, behaving more like a “lifestyle ballast” segment, moving when the unit is specific enough to justify the commitment.
Unit Size Trends & Market Signals
Unit sizes often reveal the market’s “quiet engineering”. Not just what buyers chose, but what developers are choosing to build, and what resale stock still offers. January’s size profile shows a familiar Dubai duality: compact new supply built for liquidity, and slightly roomier ready homes trading on liveability.
Median unit sizes by configuration (Jan 2026 | Flats + Hotel Apartments | Freehold)
- Studio: 38.3 sqm (~412 sq ft)
- 1BR: 73.2 sqm (~788 sq ft)
- 2BR: 116.0 sqm (~1,248 sq ft)
- 3BR: 173.0 sqm (~1,862 sq ft)
- 3BR+: 375.7 sqm (~4,044 sq ft) (thin volume segment)
📝 Interpretation
The size ladder is clean and consistent, and it supports what we saw in configuration mix: liquidity is being carried by formats that keep tickets manageable. Studios and 1BRs remain decisively compact, while 2BRs sit in a relatively stable mid-band that works for both investors and small families.
Off-plan vs Ready: where sizes differ (median actual area)
- Studios: Off-plan 37.4 sqm vs Ready 41.3 sqm
- 2BR: Off-plan 115.1 sqm vs Ready 119.5 sqm
- 3BR: Off-plan 172.3 sqm vs Ready 181.3 sqm
🧭 AIQYA Insight
January reinforces a structural pattern: new supply tends to optimise efficiency, while the ready market still holds pockets of “space premium”. The most visible gap is in studios, where off-plan units are notably tighter. This matters because compact units are the market’s liquidity engine, but it also means end-users shopping for comfort often find better spatial value in selective ready stock, even at a higher psf.
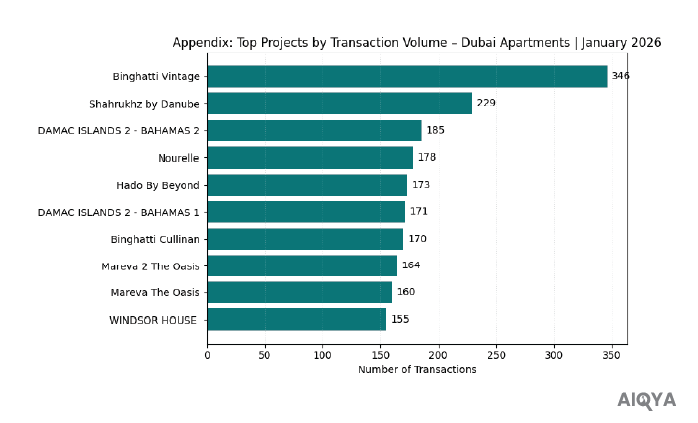
Top Projects & Developer Activity
If January is a composition month, the project leaderboard tells you who shaped that composition. The top-traded projects reveal where launch momentum concentrated, which brands pulled repeat demand, and how much of the month was driven by a broad market versus a handful of high-volume towers.
Exclusive Research. Structured Access.
To preserve quality and purpose,
AIQYA’s research is shared by request.