- Evolving Buyer Landscapes in Hyderabad’s Premium Western Belt
- Key Market Metrics – Q1 vs Q2 2025
- Price Trends & Market Interpretation
- Resale vs Developer Sales – Market Composition
- Configuration Distribution – What Are Buyers Choosing?
- Unit Size Trends & Market Signals
- Top Projects & Developer Activity – Who’s Leading Sales?
- Affordability Snapshot – Where Buyers Are Spending
- Buyer Profile & Demand Lens
- Rental Trends & Yield(estimates) Outlook – West Hyderabad Snapshot
- Configuration Spotlight – Project-Wise Breakdown
- Risks & Watchpoints
- Supply Snapshot – What’s in the Pipeline?
- Final Observations & Buyer Takeaways
Evolving Buyer Landscapes in Hyderabad’s Premium Western Belt
The West Hyderabad Premium Corridor, anchored by Kokapet, Narsingi, and Puppalguda, continues to reflect a dynamic recalibration in buyer sentiment. While Kokapet remains the flagship zone for luxury towers and branded launches, adjacent micro-markets like Narsingi and Puppalguda have emerged as stabilizing alternatives, offering gated community living at more measured price points.
Q2 2025 marked a phase of consolidation rather than exuberance. Developer sales continued to dominate across all three markets, but resale activity stayed consistent — particularly in Puppalguda and Narsingi — indicating a maturing end-user ecosystem. Price trends suggest that while Kokapet still commands premium rates, the gap is narrowing due to value-conscious absorption in Narsingi and Puppalguda.
Across the board, 3 BHKs priced under ₹1.5 Cr remained the configuration of choice, with buyers seeking ready or near-possession units in well-placed gated communities. The corridor’s continued appeal lies in its ORR access, educational and lifestyle infrastructure, and the diversity of offerings across budgets — from compact 2.5 BHKs to luxury sky villas.
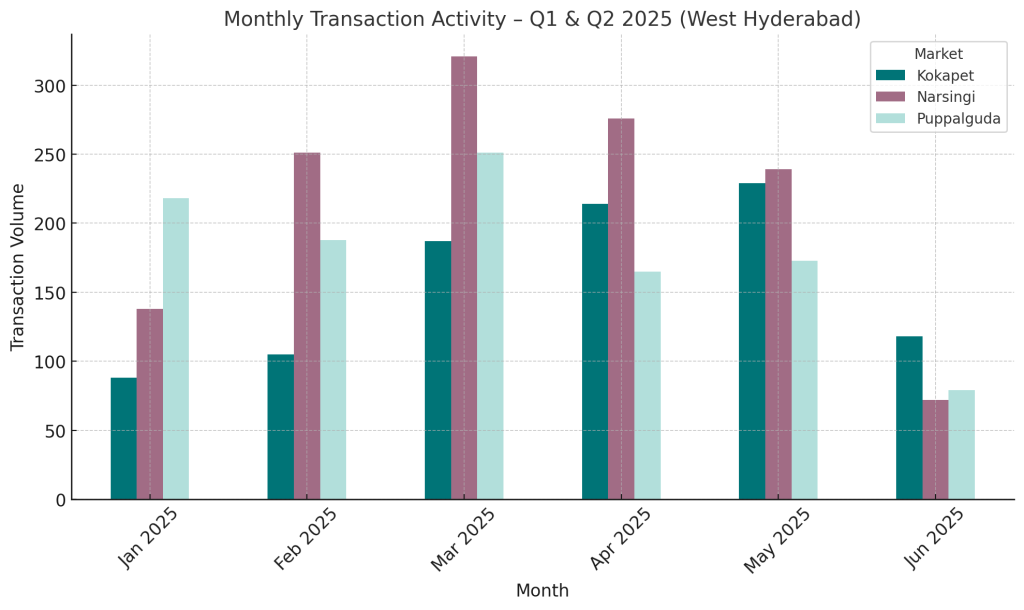
Kokapet posts sustained momentum from March to May, peaking in late Q2. Narsingi’s activity tapers steadily after a strong Q1 close, and Puppalguda’s slowdown post-March reflects softening demand in its core affordable segment.
Key Market Metrics – Q1 vs Q2 2025
| Metric | Kokapet Q1 | Kokapet Q2 | Narsingi Q1 | Narsingi Q2 | Puppalguda Q1 | Puppalguda Q2 |
| Total Transactions | 380 | 561 | 710 | 587 | 657 | 417 |
| Avg Price (₹/sft) | ₹8,482 | ₹8,773 | ₹6,685 | ₹6,949 | ₹5,210 | ₹4,700 |
| Median Price (₹/sft) | ₹7,288 | ₹7,968 | ₹7,093 | ₹7,347 | ₹4,334 | ₹4,516 |
| Developer Share (%) | 82.1% | 88.9% | 82.1% | 87.4% | 65.9% | 64.7% |
| Resale Share (%) | 17.9% | 11.1% | 17.9% | 12.6% | 34.1% | 35.3% |
What the Numbers Say:
- Kokapet saw a strong +47.6% jump in sales volume in Q2 (380 → 561), driven by large-scale project launches and active developer campaigns. Both average price (+3.4%) and median price (+9.3%) rose, reflecting absorption across mid- to high-end inventory rather than discount-led sales.
- Narsingi recorded a –17.3% drop in transactions (710 → 587) but still posted gains in both average price (+4.0%) and median price (+3.6%), indicating steady end-user demand for nearing-possession and ready inventory.
- Puppalguda experienced the steepest decline, with transaction volume down –36.5% (657 → 417). Median prices climbed (+4.2%) even as the average fell (–9.8%), suggesting buyers shifted toward well-priced, functional configurations and avoided higher-ticket outliers.
- Resale share remained highest in Puppalguda (35.3%), underlining its maturity as an end-user–driven market. Kokapet’s resale share dipped to just 11.1%, reinforcing its developer-dominated, launch-heavy profile.
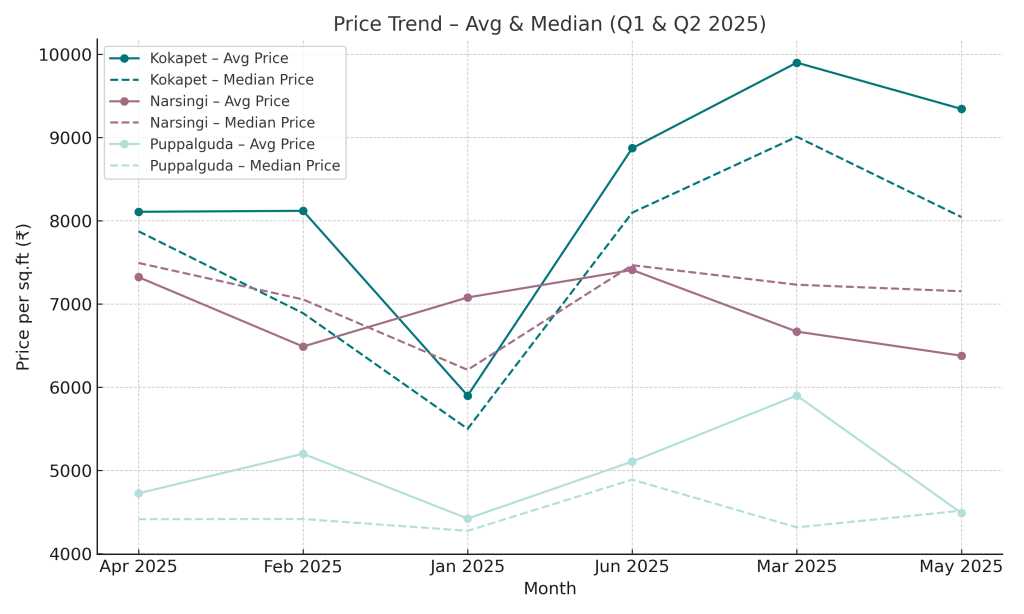
Monthly average and median price movement for Kokapet, Narsingi, and Puppalguda,
highlighting market fluctuations and pricing patterns across two quarters.
Exclusive Research. Structured Access.
To preserve quality and purpose,
AIQYA’s research is shared by request.